Track custom metrics
Metrics let you measure any player behavior your game tracks. Defined once against an analytic event, they become available across all of Satori. You can also plot multiple metrics on a single chart and filter by live event or experiment. This page covers how to create and manage custom metrics.
level_complete event first. The metric you create would also be named level_complete. See Understand events
for how to create and send a custom event.Create a metric #
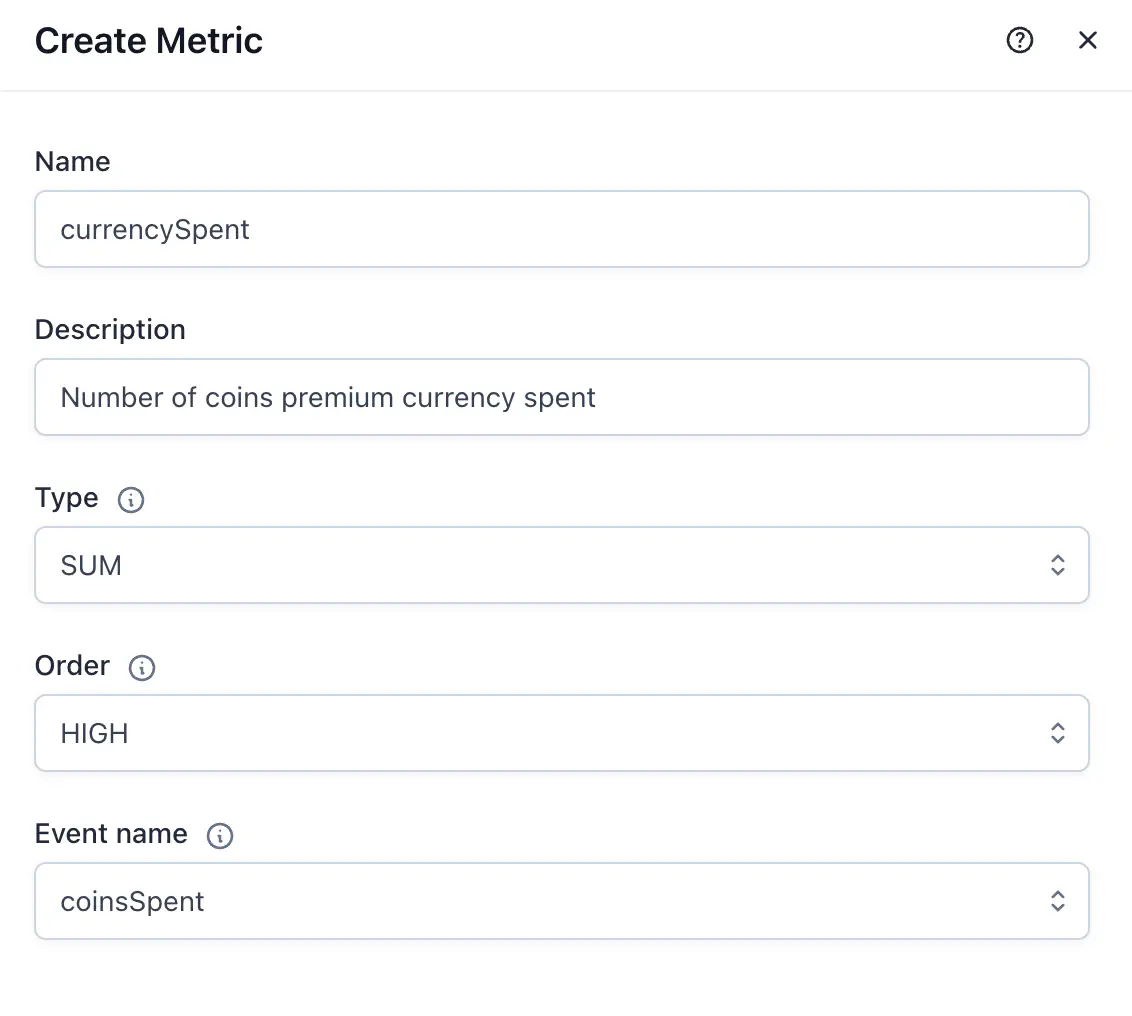
In the Satori console, open Metrics.
- Click + New Metric.
- Enter a Name. This must match the name of an event your game is tracking.
- Enter a Description.
- Select a Type. See Metric types below.
- Select an Order:
- High if higher values indicate better performance, for example revenue or session count.
- Low if lower values indicate better performance, for example tutorial completion time.
- Click Save.
The metric is now available in any experiment, feature flag, or live event.
Metric types #
| Type | What it measures | Use when |
|---|---|---|
| Binomial | Whether the player has the event or not: 1 for having the event, 0 for not having. This metric provides the distinct number of players who had the event. | Tracking conversions: did the player make a purchase, complete a tutorial, or open a message? |
| Count | How many times the event occurred | Tracking frequency: how many levels completed, items crafted, or sessions started? |
| Sum | The total value of the event over a period | Tracking accumulation: total spend, total distance travelled. Expects a numeric value from the event. |
| Duration | The total time the event lasted | Tracking time-in-feature: time spent in the store or on a level. Expects a value in seconds. |
| Revenue | Total revenue generated by the event | Tracking monetization. Expects a value in USD cents. |
Use a metric in an operation #
Once created, a metric is available across all your operations. Satori begins tracking it from the moment the operation goes live. Historical event data isn’t backfilled.
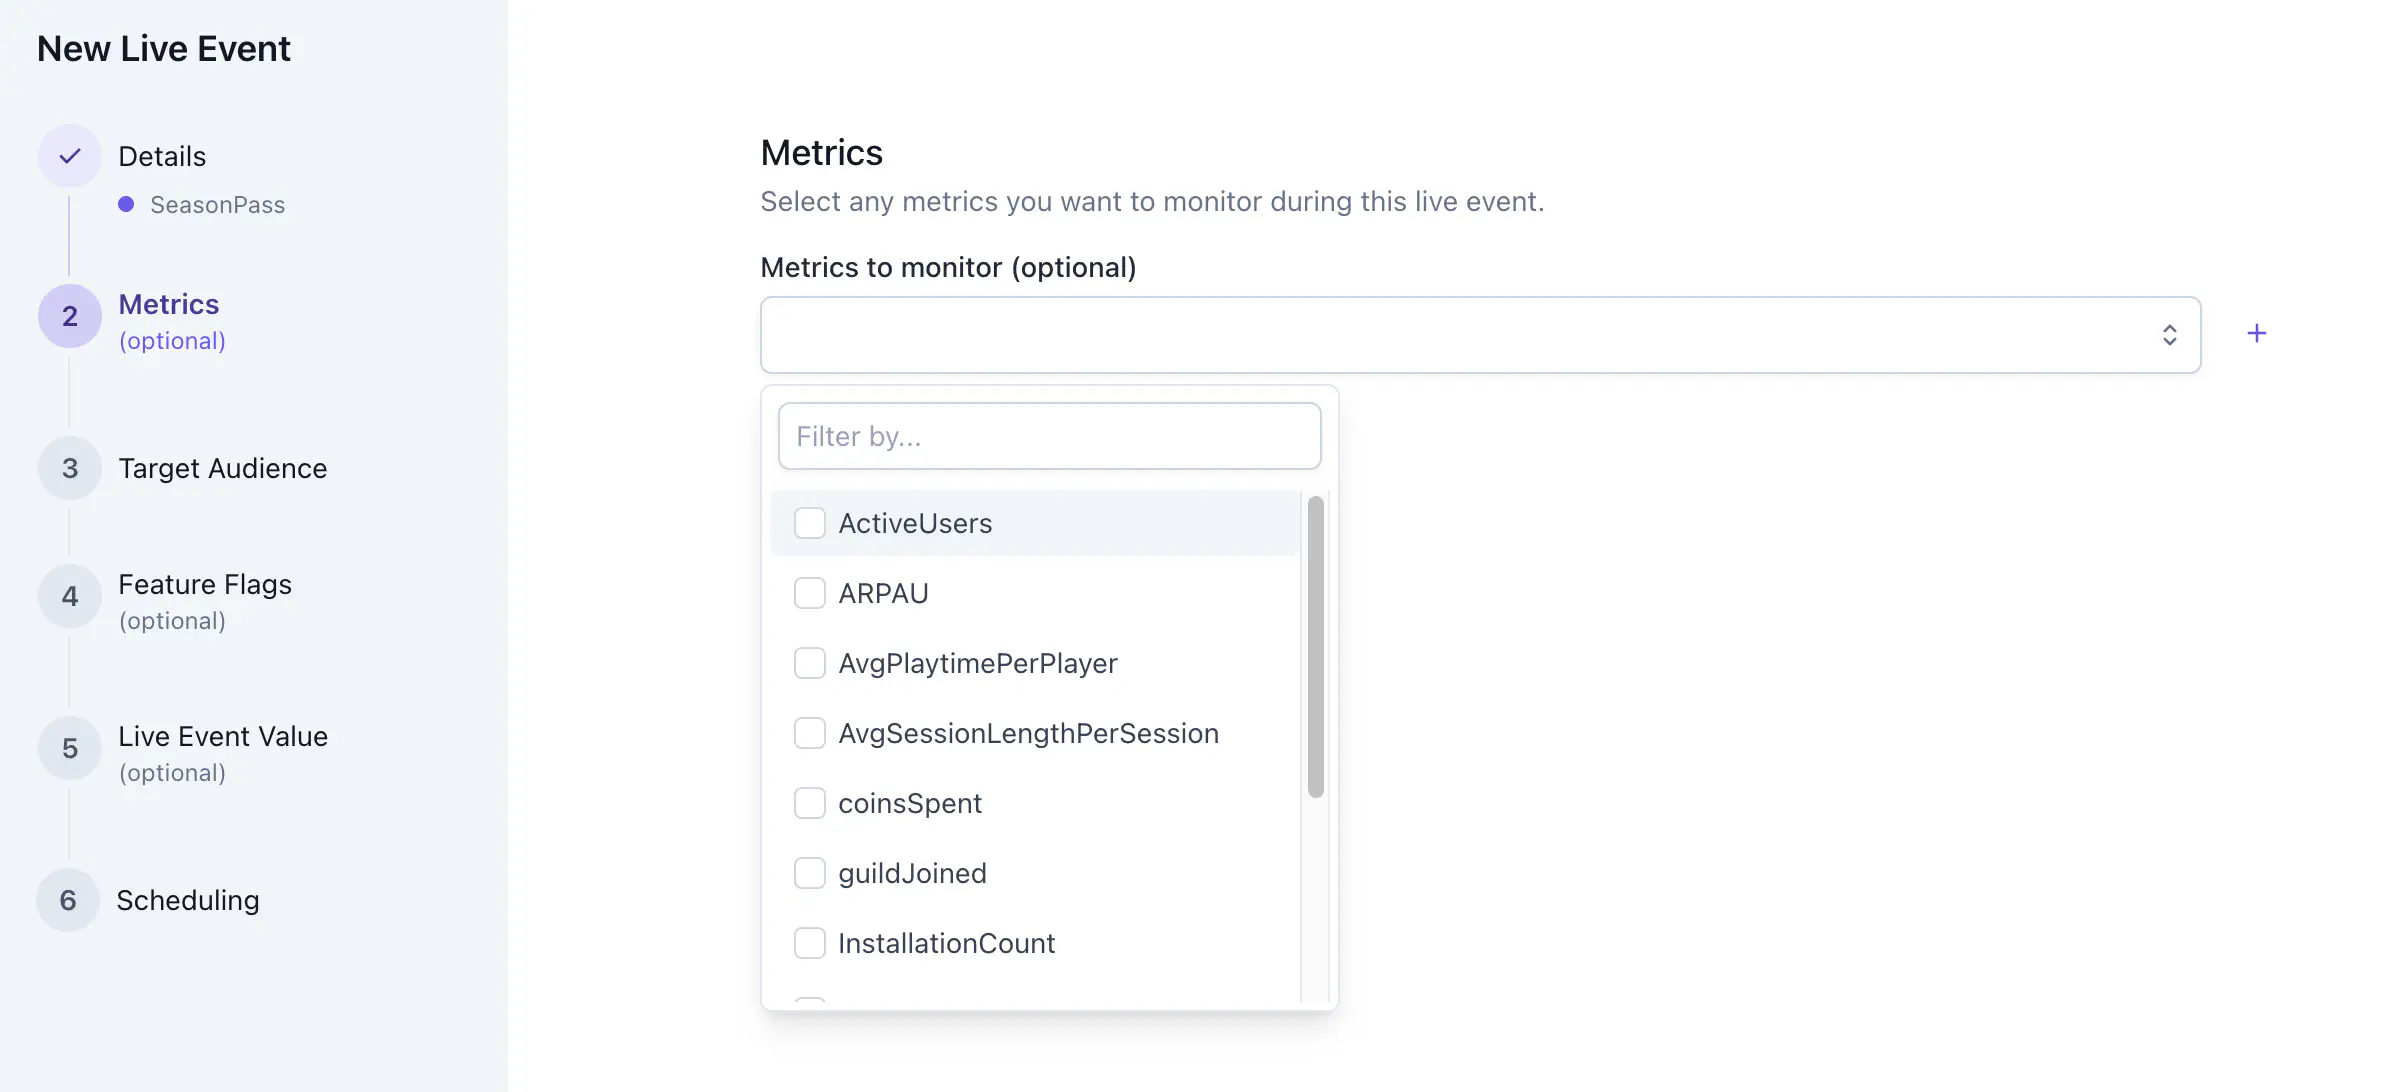
Add metrics to a live event #
When defining a new live event, you can add multiple metrics to monitor as it runs. You can also add or edit metrics on an existing live event. For more information, see Manage live events .
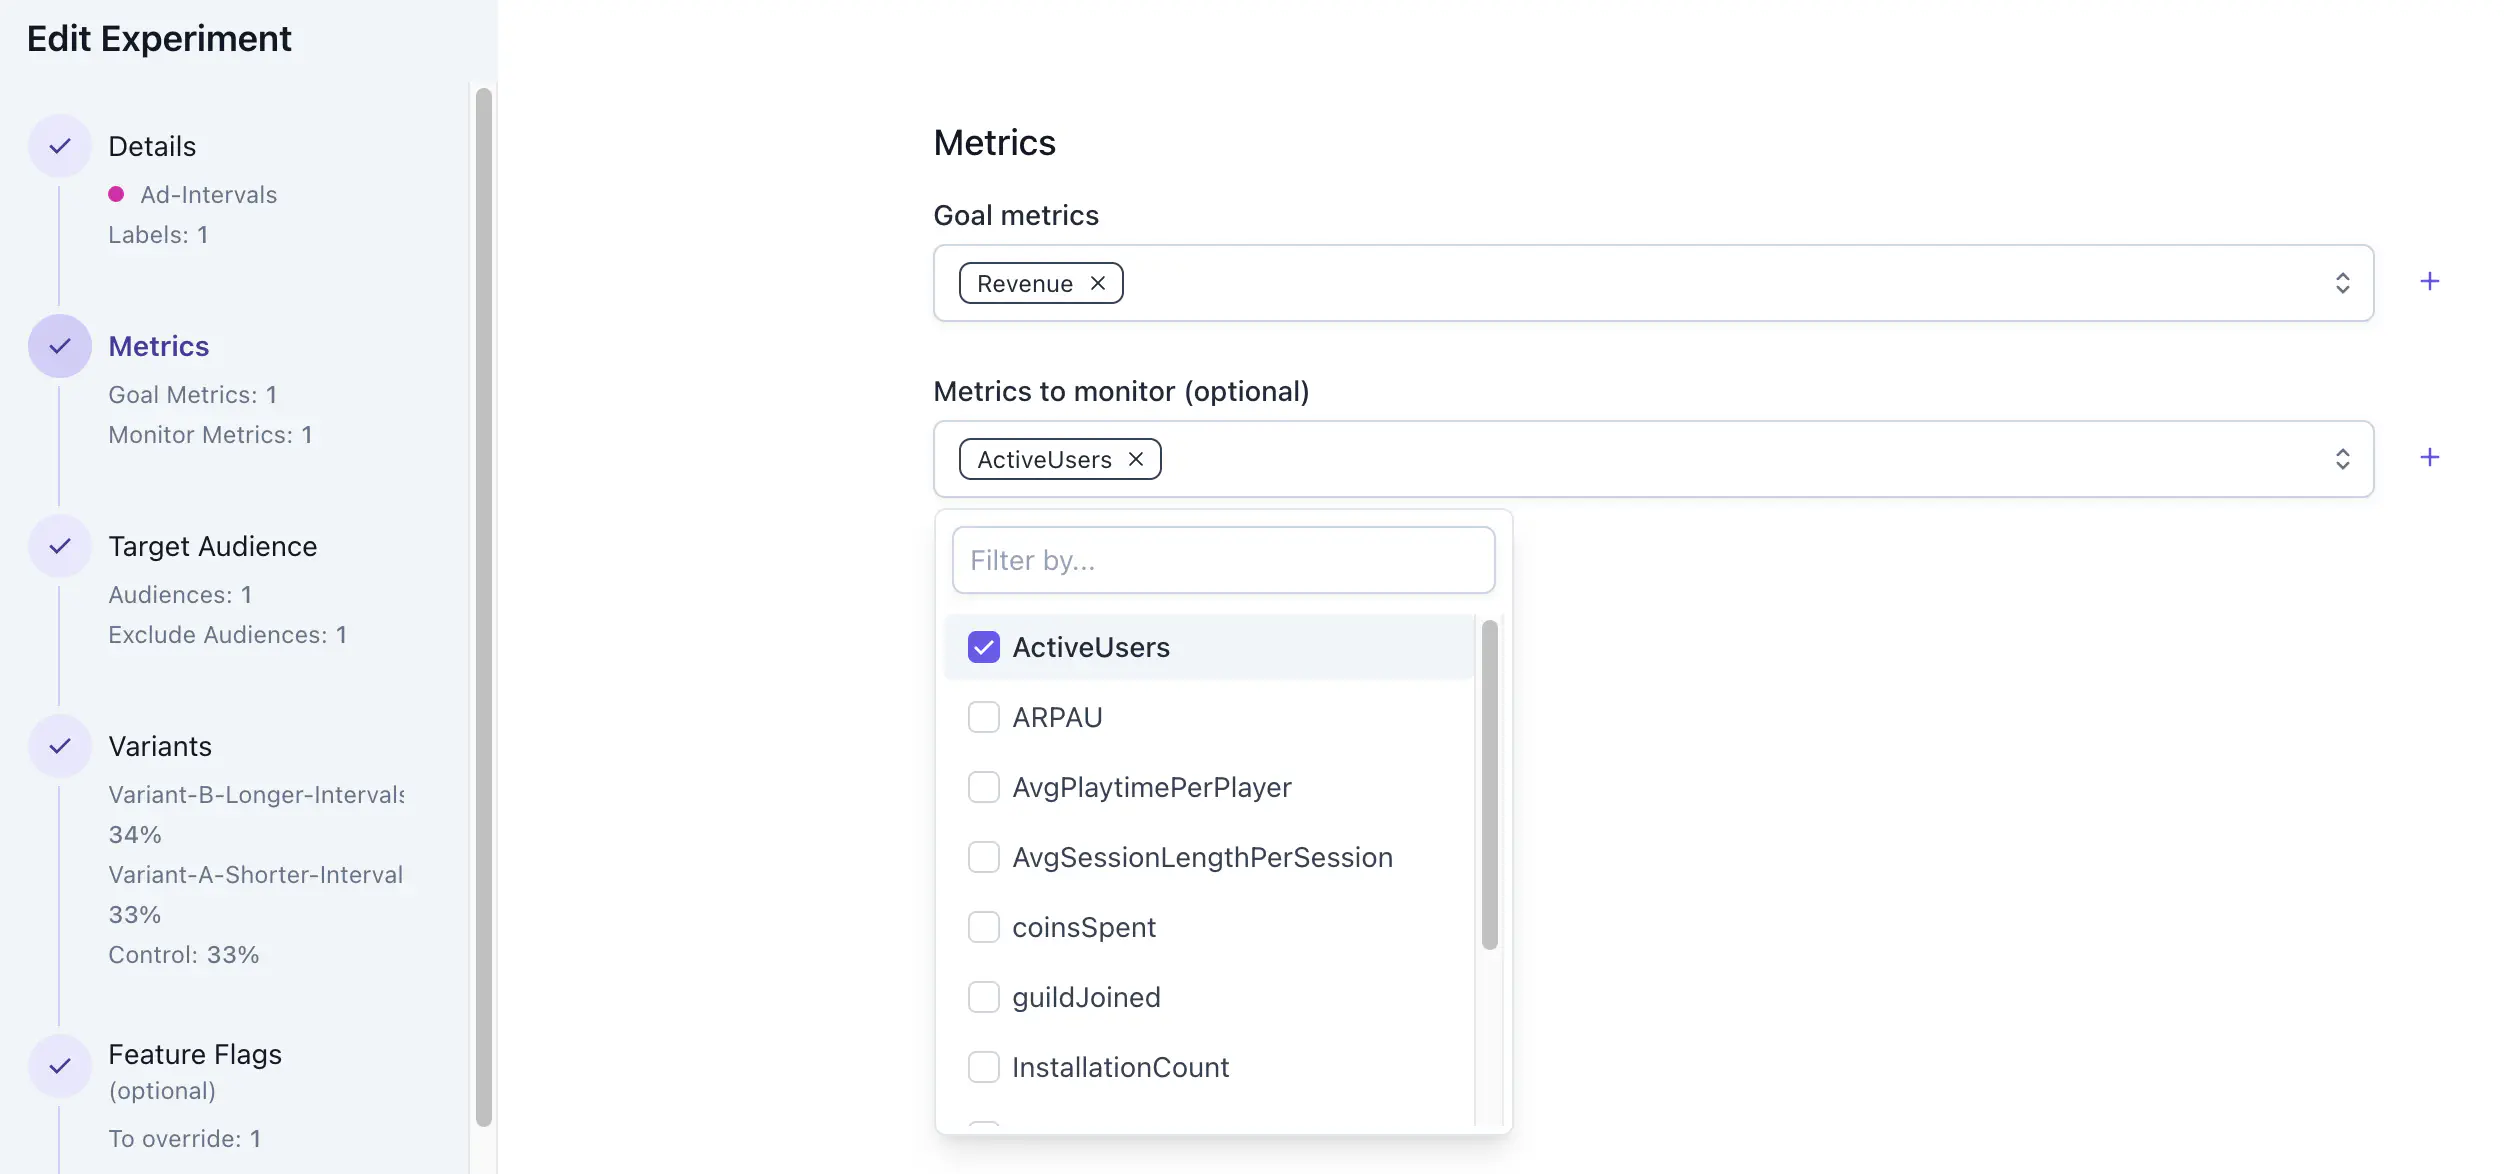
Add metrics to an experiment #
Add a metric to an experiment as a goal metric or a monitor metric. Goal metrics test your primary hypothesis. Monitor metrics watch for unintended effects on other player behaviors. When defining a new experiment, you can add multiple metrics to track as it runs. You can also add or edit metrics on an existing experiment. For more information, see Monitor and analyze .
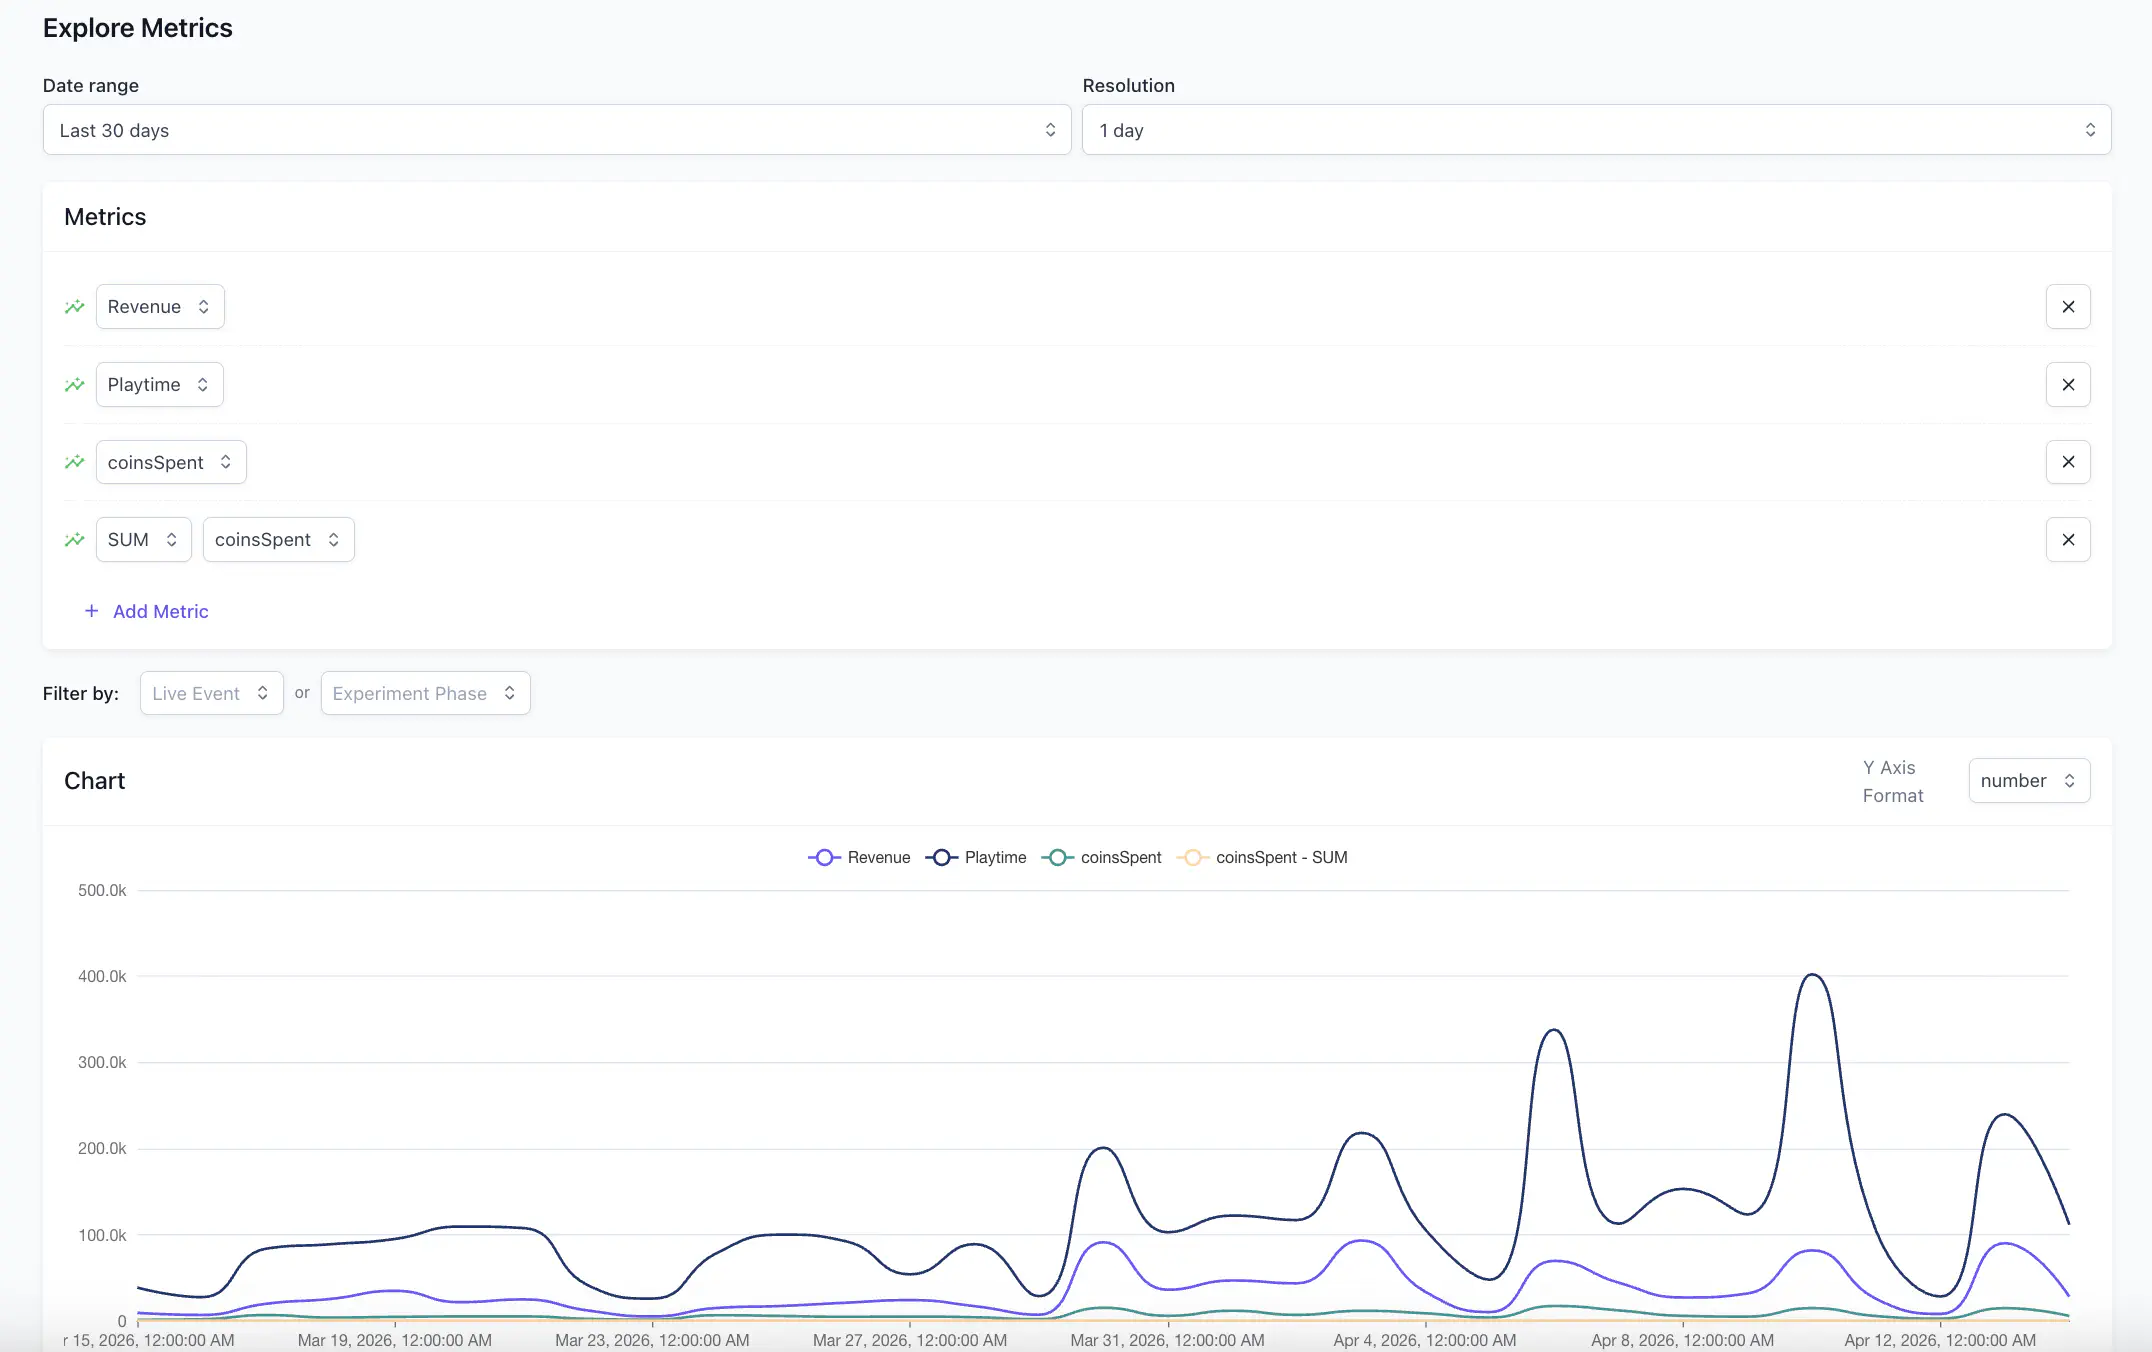
Explore and visualize metrics #
Use the Explore Metrics page on the Satori console to plot multiple metrics on a single chart and compare trends across any date range. You can overlay several metrics at once and filter the chart by a specific live event or experiment phase to isolate the data you need.
To explore metrics:
- Set the Date range and Resolution for the chart.
- In the Metrics section, select a metric from the dropdown or enter a Custom Metric.
- Select + Add Metric to add additional metrics to the same chart.
- Optionally, filter the chart by a Live Event or Experiment Phase to scope the results.
- Use the Y Axis Format control to switch between number and percentage display.
Each metric appears as a separate line on the chart. Remove a metric at any time by selecting X next to its name.