Analyze return on ad spend (RoAS)
Satori provides a return on ad spend (RoAS) report out of the box. It combines cost-per-install (CPI) data from your mobile measurement partner (MMP) integration with lifetime value data from Satori. See which player cohorts have recovered their acquisition cost and how long it took, tracked from Day 0 through Day 30.
Before you begin #
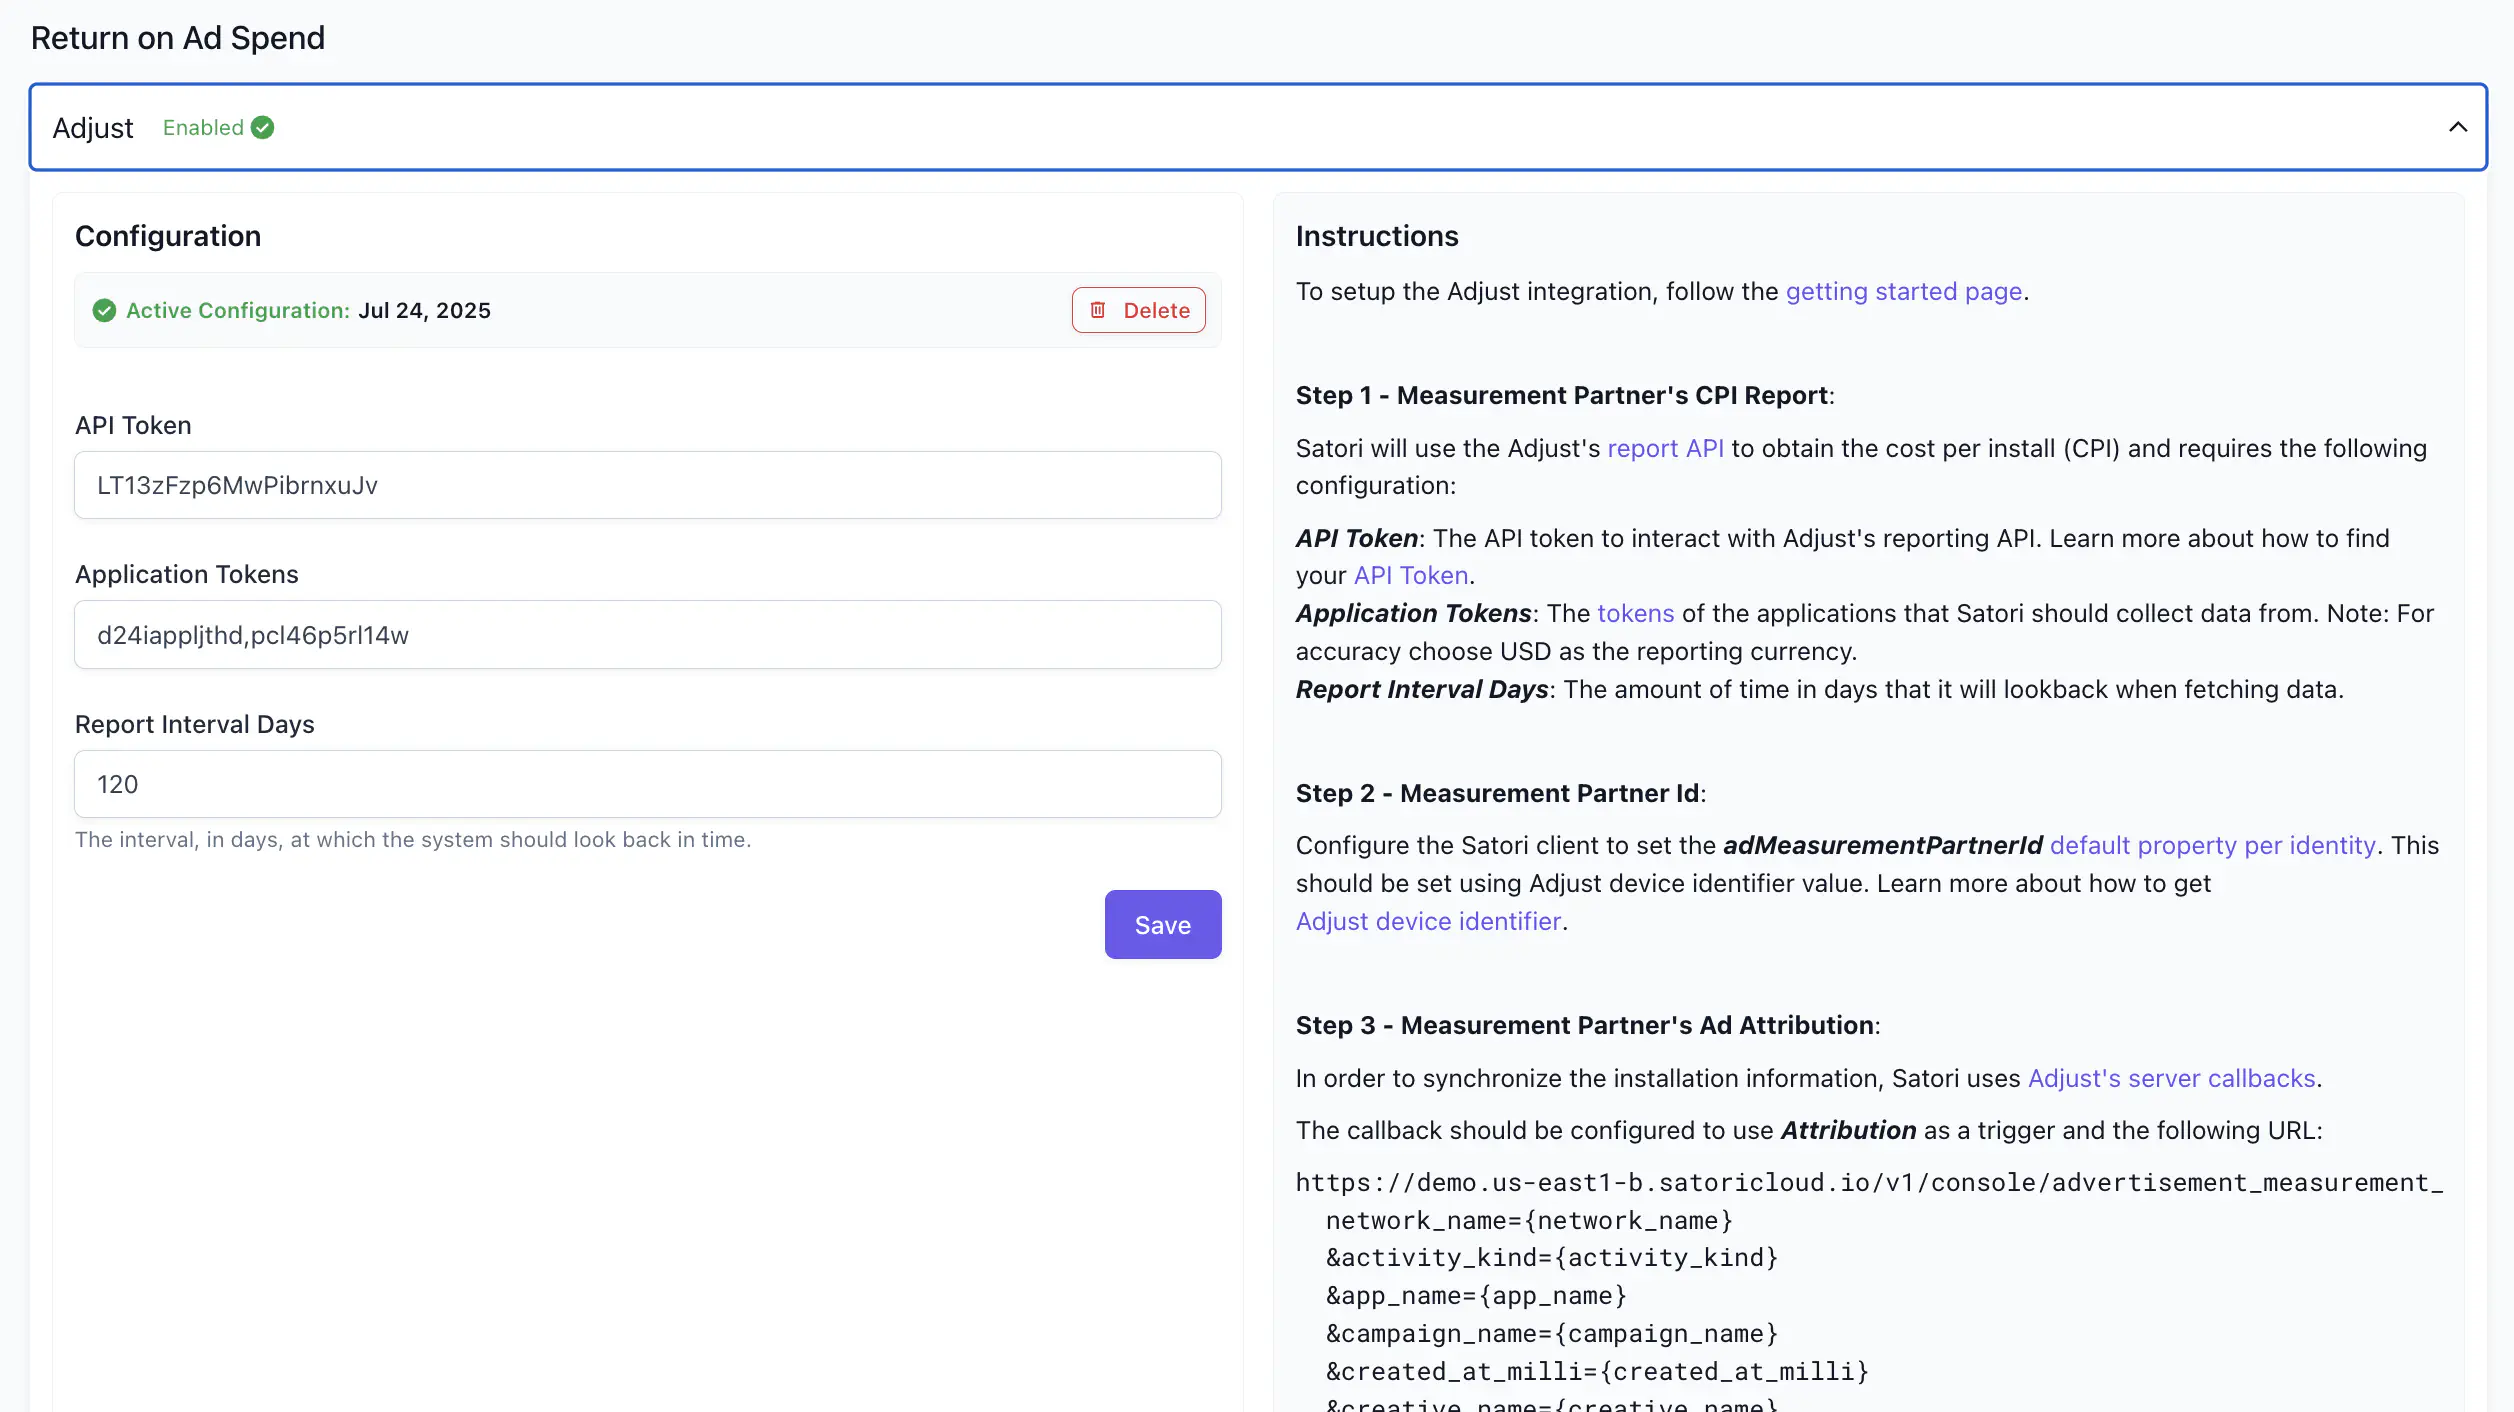
The RoAS report requires an MMP integration. Enable the integration in Settings > Integrations before the report will populate.
CPI is estimated from the combination of Satori and MMP data and may differ slightly from figures reported directly by your MMP.
How the report is organized #
The RoAS report has three sections: summary cards, cohort table, and key stats.
Summary cards #
Summary cards show headline numbers for the current filter state. See average cost-per-install, average lifetime value and RoAS over the game’s lifetime, and running totals across a player’s full recorded history. Lifetime Day values represent the LTV and RoaS at a specific day milestone. Use the dropdown to change the day milestone.

Cohort table #
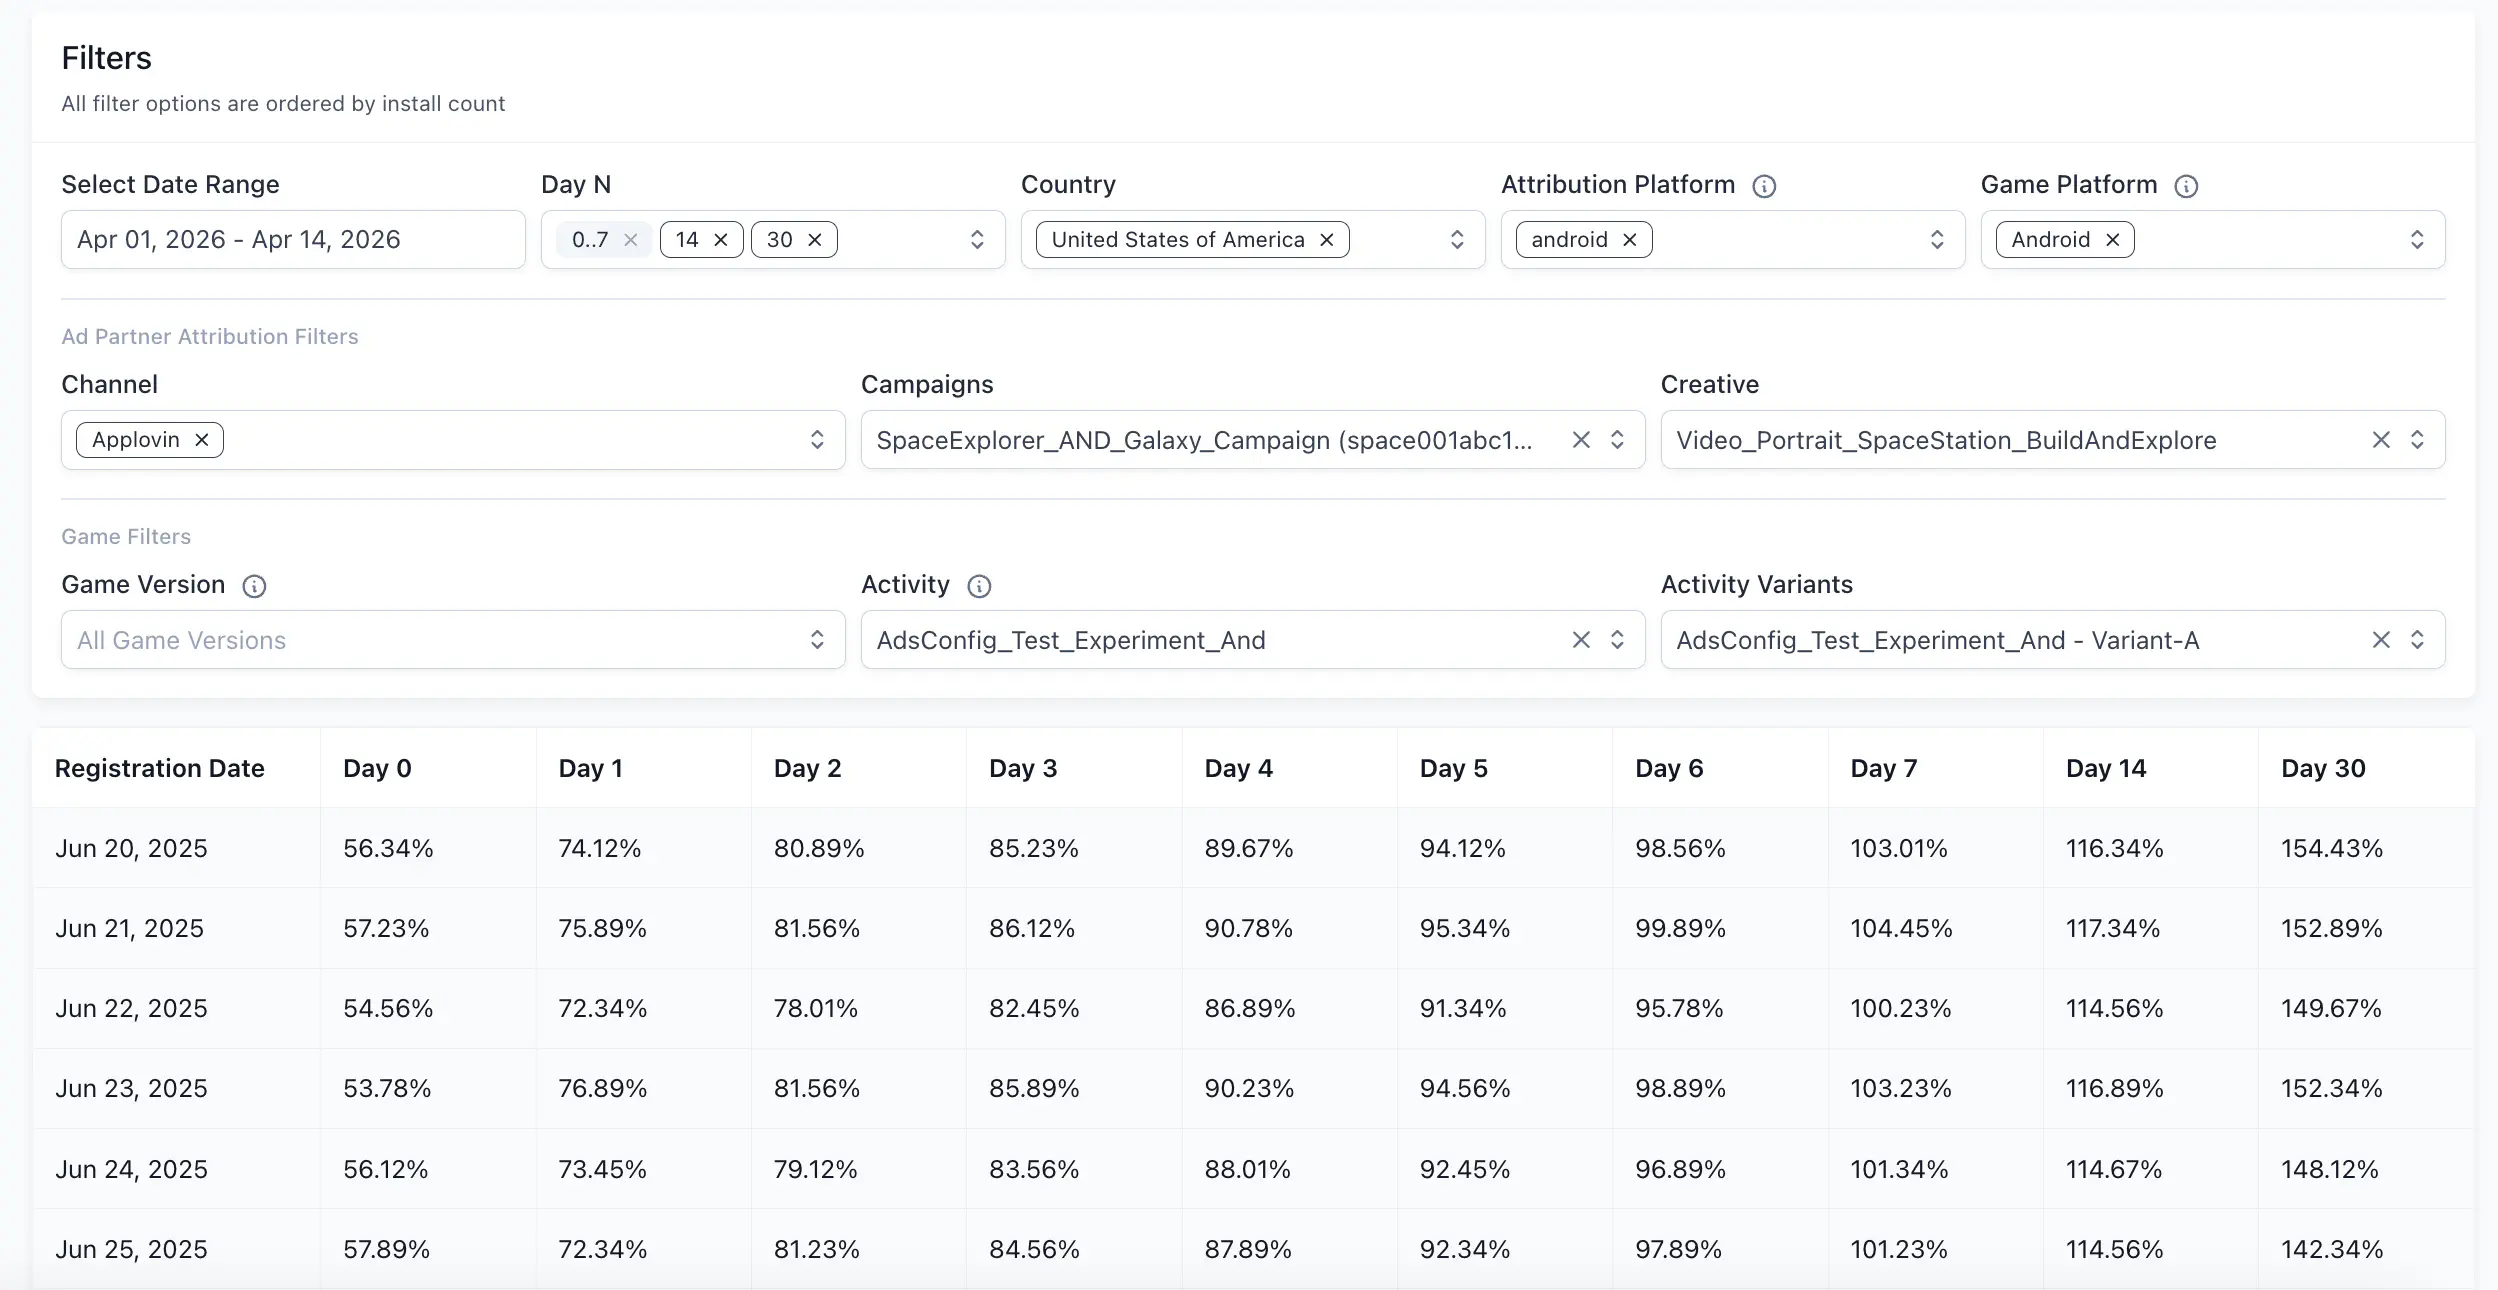
Cohort table is the main grid. Each row is a registration date cohort. Each column is a day milestone (Day 0 through Day 30). Each cell shows the RoAS percentage for that cohort at that point in time.
Read the cohort table #
Each cell in the cohort table shows a cumulative RoAS percentage. A value of 84.29% on Day 3 means players from that cohort had collectively returned 84.29% of their acquisition cost by Day 3. A value above 100% means the cohort has exceeded its acquisition cost and is generating positive return.
All LTV and RoAS values in this report are cumulative. Day 7 RoAS includes all revenue from Day 0 through Day 7, not Day 7 alone.
Filter the report #
Use filters to scope the report to a specific acquisition period, geography, or set of day milestones. All filter options are ordered by install count.
The base filters are always visible:
| Filter | What it does |
|---|---|
| Date Range | Sets the cohort window. Only players who registered within this range are included. |
| Day N | Selects which day milestones appear as columns in the table. You can select multiple days. All selected days appear as columns simultaneously. |
| Country | Filters by country. Selecting a country unlocks the Ad Partner Attribution and Game filter groups below. |
Selecting a country unlocks two additional filter groups.
Ad Partner Attribution Filters narrow the cohort by how players were acquired. Game Filters narrow the cohort by in-game properties and operations.
| Filter | What it does |
|---|---|
| Ad Partner Attribution Filters | |
| Channel | Filters by ad network or acquisition channel (for example, Applovin). |
| Campaigns | Filters by campaign name as reported by your MMP. |
| Creative | Filters by the specific ad creative used to acquire the cohort. |
| Game Filters | |
| Game Version | Filters by the version property on player identities. |
| Activity | Filters to players who participated in a specific experiment or live event. |
| Activity Variants | Filters to players in a specific variant within the selected activity. Only visible when an Activity is selected. |
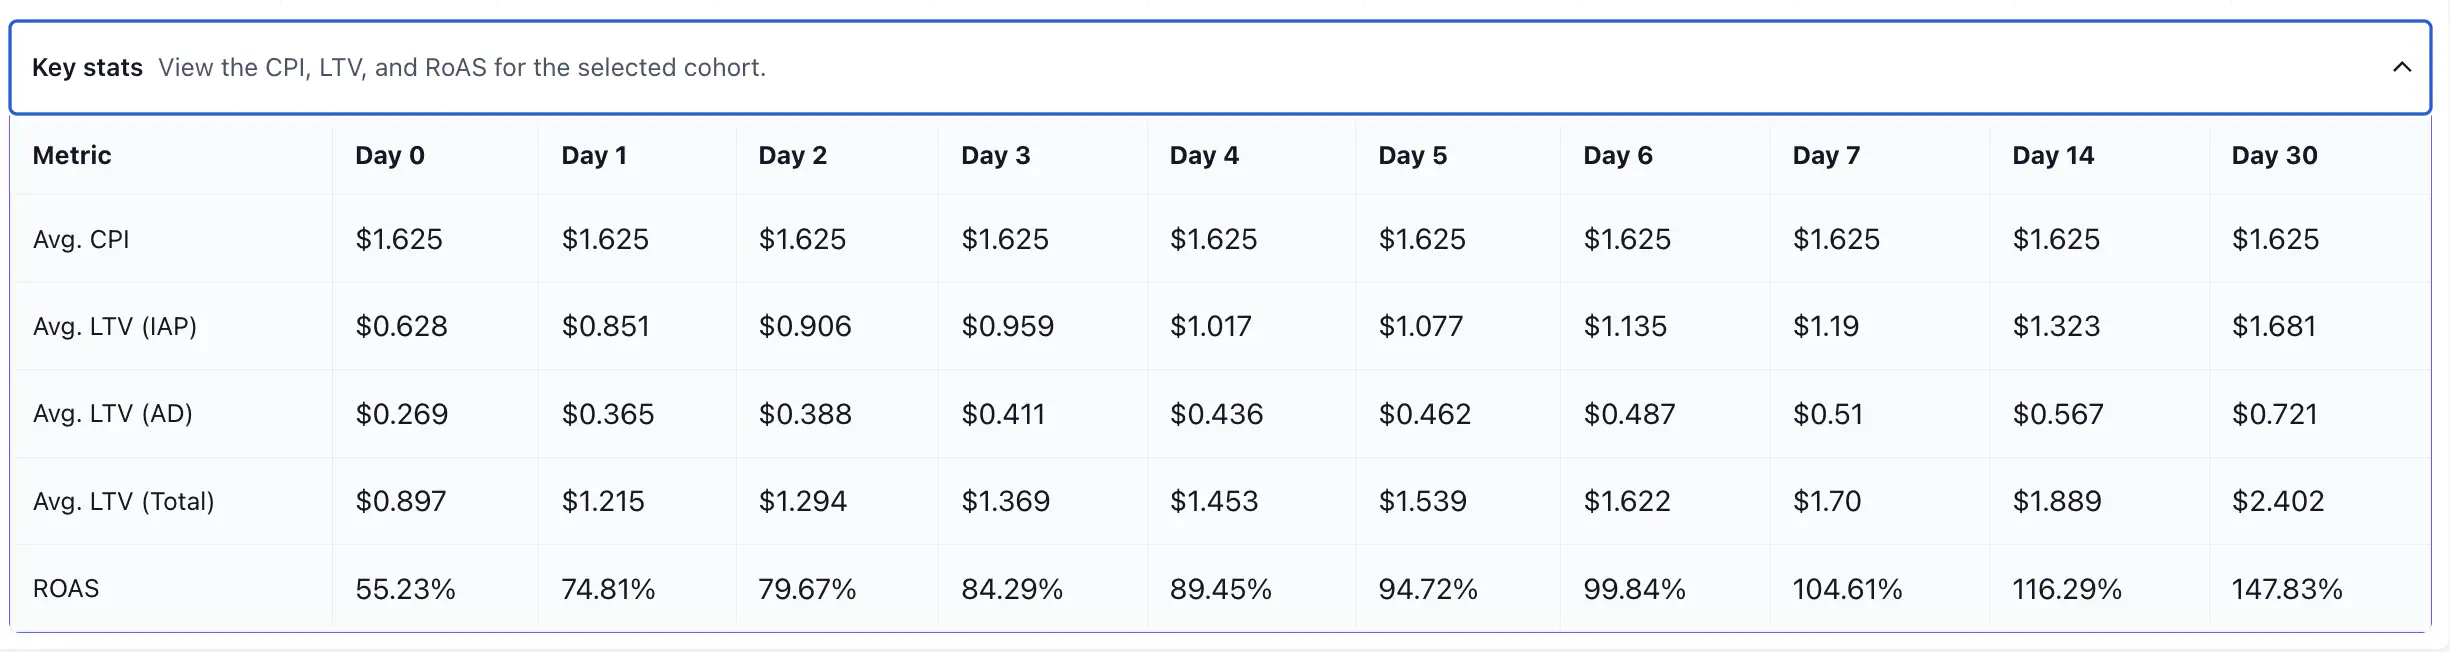
Key stats #
The Key Stats section breaks down the metrics that produce the RoAS figure.
| Metric | What it shows |
|---|---|
| Avg. CPI | The average cost to acquire one player in this cohort. Derived from MMP data, this value is fixed per cohort and doesn’t change across days. |
| Avg. LTV (IAP) | Cumulative average revenue from in-app purchases per player, up to that day. |
| Avg. LTV (AD) | Cumulative average revenue from ad impressions per player, up to that day. |
| Avg. LTV (Total) | Sum of IAP and AD LTV. This is the revenue figure used to calculate RoAS. |
| RoAS | Avg. LTV (Total) divided by Avg. CPI, expressed as a percentage. |
