Analyze retention
Satori provides ready-to-use reports for game teams to easily track player retention. Use the report to:
- Measure how many players return to your game after their first session, from Day 1 through Day 30.
- Assess the impact of an operation on long-term engagement by filtering on a specific live event or experiment variant.
How the report is organized #
The Retention report has three sections: Lifetime Engagement, Key Stats, and Retention.
Lifetime engagement #
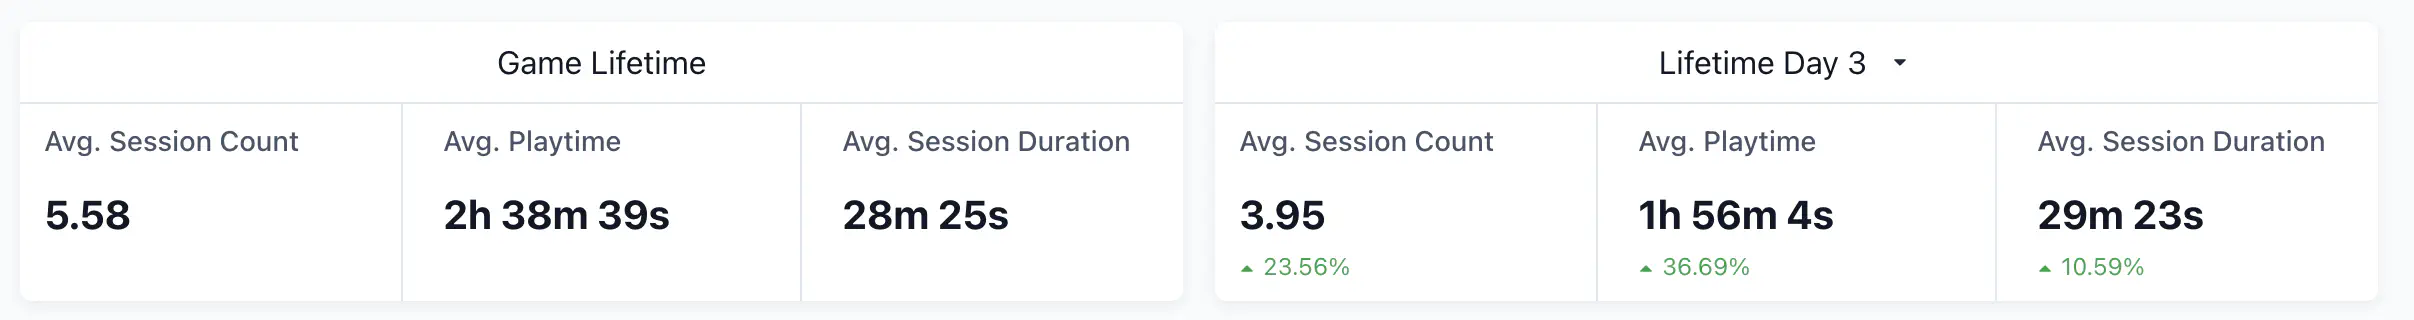
Lifetime Engagement shows average session count, playtime, and session duration across all players. Session Duration is calculated as the time between the first and last event in a session. Playtime is the total time across all sessions in a player’s lifetime.
The report also shows Lifetime Day X metrics. These are the same engagement values, but calculated only for players who were active on a specific day. For example, Lifetime Day 3 shows session count, playtime, and session duration only for players who played on Day 3.
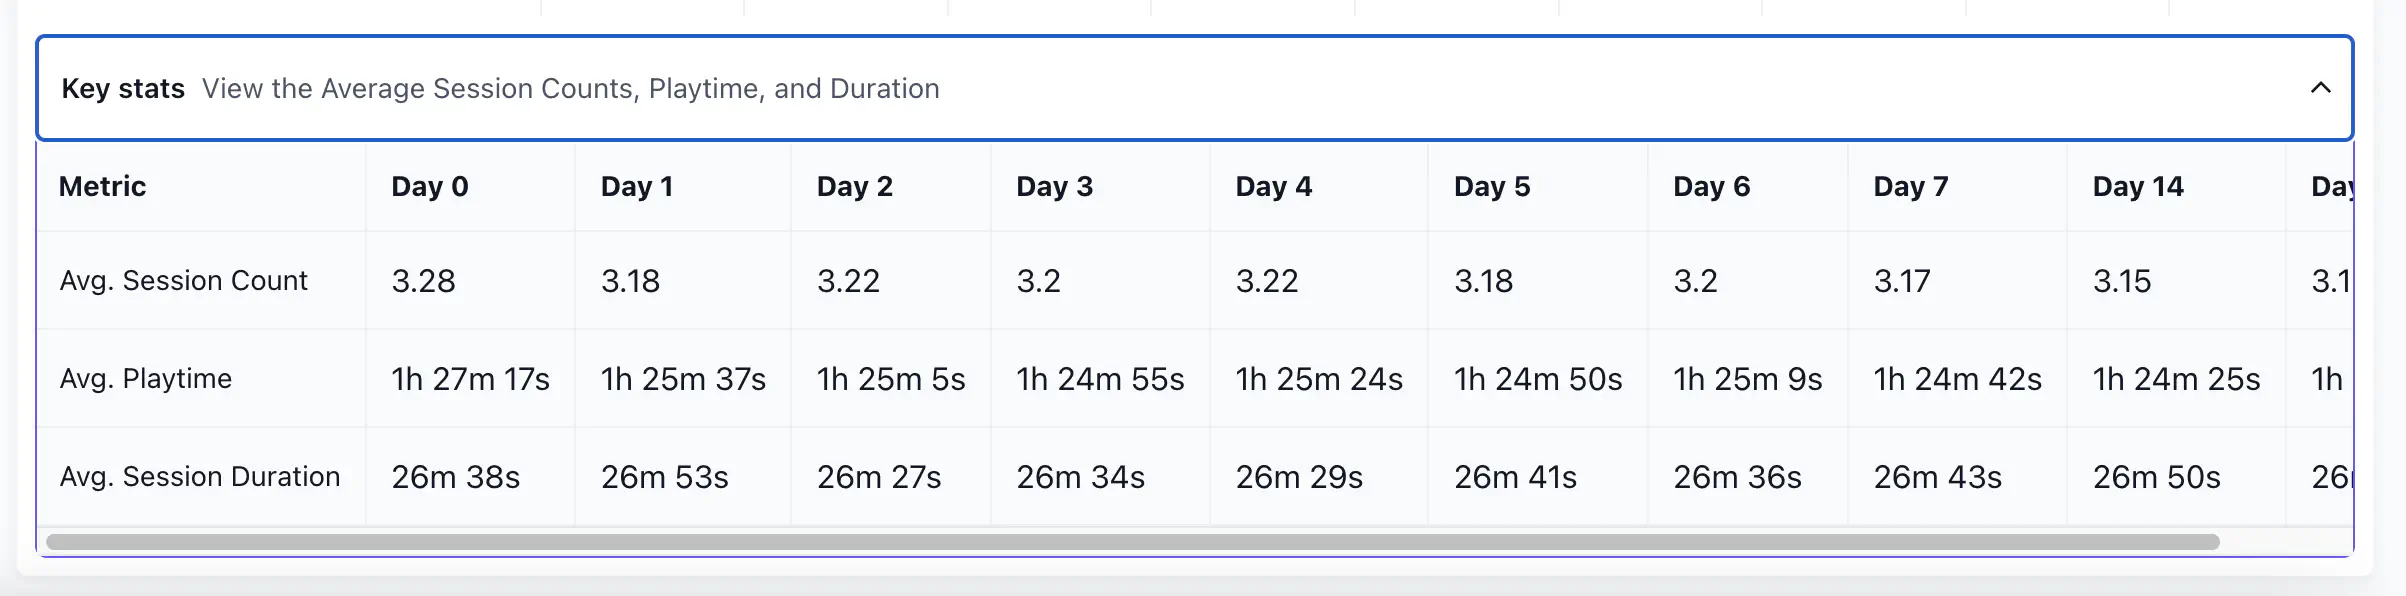
Key stats #
Key Stats show average session count, playtime, and session duration for the filtered cohort, broken down across the same day range as the Retention section.
Retention #
Retention shows the percentage of players who returned on each day from Day 1 through Day 7, Day 14, and Day 30. This is the core of the report. Apply filters here to narrow the cohort.
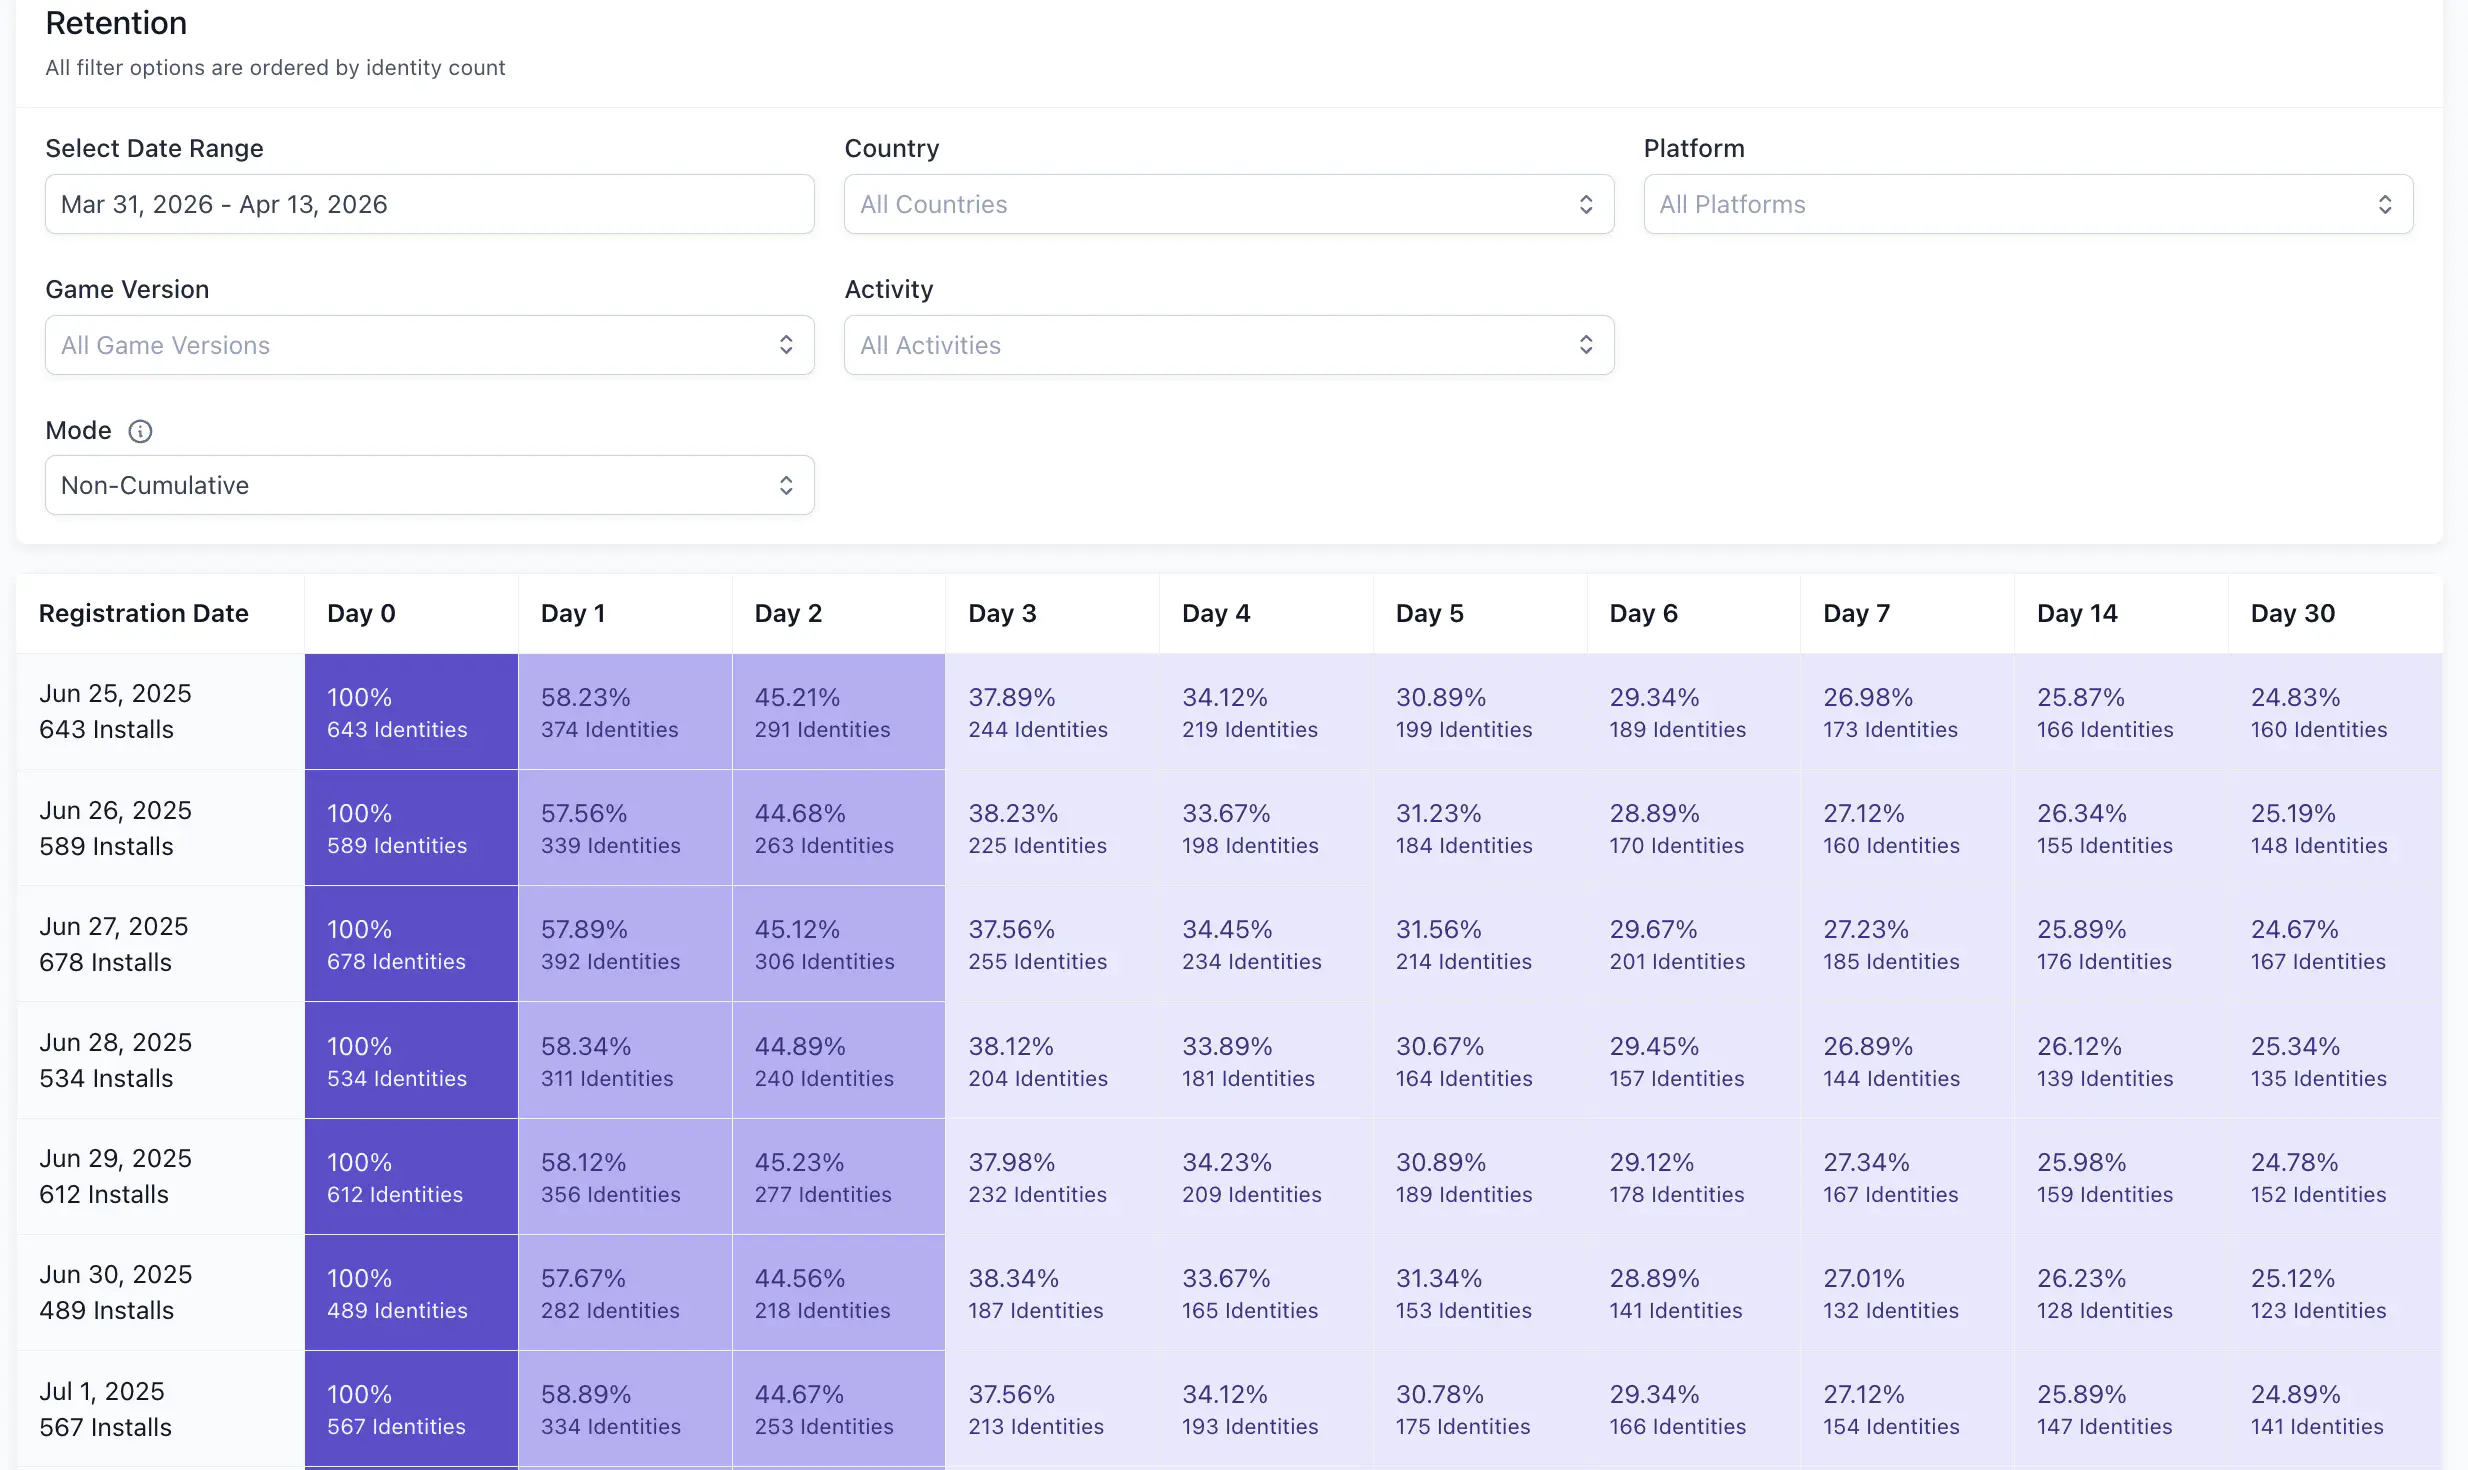
Read the retention grid #
The retention grid shows one row per cohort date and one column per day milestone (D1 through D7, D14, D30). Each cell shows the percentage of players from that cohort who returned on that specific day.
By default, the report is non-cumulative: each day shows activity for that day only. Switch to cumulative mode to see running totals. Use cumulative mode when you want to know how many players returned at least once by a given day, rather than how many returned on exactly that day.
Filter the report #
Use filters to narrow the cohort before reading the retention grid. All filters apply to the Retention and Key Stats sections. Lifetime Engagement is always unfiltered.
| Filter | What it does |
|---|---|
| Date Range | Sets the cohort window. Default is the last 14 days. Supports up to 92 days. Quick options include Last 7 Days and This Month. |
| Country | Filters by the CountryCode property on player identities. CountryCode is the country in which the player installed the game. |
| Game Version | Filters by the install version property on player identities. |
| Platform | Filters by the install platform property on player identities. |
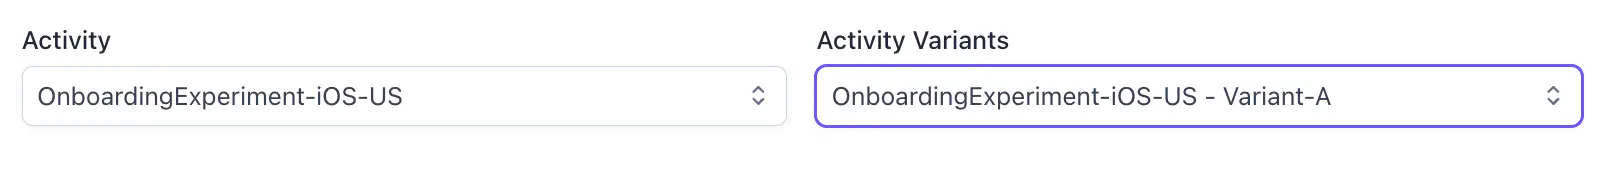
| Activity | Filters to players who participated in a selected experiment or live event. |
| Activity Variant | Filters to players in a specific variant within the selected activity. Only visible when an Activity is selected. |
| Mode | Toggles between cumulative and non-cumulative views. |
How multiple filters interact #
When you apply filters from different categories, the report includes only players who meet all conditions (intersection). When you select multiple options within a single filter, the report includes players who meet any of those options (union). For example, selecting Country = US and Country = GB includes players from either country, but adding Platform = iOS then restricts that group to iOS players only.
Scope retention to an operation #
The Activity and Activity Variant filters let you measure retention for players who were part of a specific live event or experiment. This is the most direct way to evaluate whether an operation had a lasting effect on engagement.