Using VSCode Debugger #

With some minor modifications to the directions in Debugging with Delve guide, you can debug your custom Go server runtime code using Delve inside a Docker container via Visual Studio Code.

Dockerfile #

The same Dockerfile is used, with the only change being the removal of the ENTRYPOINT line:

 1
 2
 3
 4
 5
 6
 7
 8
 9
10
11
12
13
14
15
16
17
18
19
20
21
22
FROM registry.heroiclabs.com/heroiclabs/nakama-pluginbuilder:3.16.0 AS go-builder
ENV GO111MODULE on
ENV CGO_ENABLED 1
WORKDIR /backend

RUN apt-get update && \
    apt-get -y upgrade && \
    apt-get install -y --no-install-recommends gcc libc6-dev

RUN go install github.com/go-delve/delve/cmd/dlv@latest

COPY go.mod .
COPY vendor/ vendor/
COPY *.go .

RUN go build --trimpath --gcflags "all=-N -l" --mod=vendor --buildmode=plugin -o ./backend.so

FROM registry.heroiclabs.com/heroiclabs/nakama-dsym:3.16.0

COPY --from=go-builder /go/bin/dlv /nakama
COPY --from=go-builder /backend/backend.so /nakama/data/modules/
COPY local.yml /nakama/data/

Docker Compose file #

In the Docker Compose file, we add the entrypoint property to the nakama server and set it to run the container using the dlv command. We also add the Delve port (4000) to the ports property.

 1
 2
 3
 4
 5
 6
 7
 8
 9
10
11
12
13
14
15
16
17
18
19
20
21
22
23
24
25
26
27
28
29
30
31
32
33
34
35
36
37
38
39
40
41
42
43
44
45
46
47
48
49
50
51
52
53
version: '3'
services:
  postgres:
    command: postgres -c shared_preload_libraries=pg_stat_statements -c pg_stat_statements.track=all
    environment:
      - POSTGRES_DB=nakama
      - POSTGRES_PASSWORD=localdb
    expose:
      - "8080"
      - "5432"
    image: postgres:12.2-alpine
    ports:
      - "5432:5432"
      - "8080:8080"
    volumes:
      - data:/var/lib/postgresql/data
  nakama:
    build:
        context: .
        dockerfile: Dockerfile
    entrypoint:
      - "/bin/sh"
      - "-ecx"
      - >
        /nakama/nakama migrate up --database.address postgres:localdb@postgres:5432/nakama &&
        /nakama/dlv --log --log-output=debugger --listen=:4000 --headless=true --api-version=2 exec nakama -- --config /nakama/data/local.yml --database.address postgres:localdb@postgres:5432/nakama        
    depends_on:
      - postgres
    expose:
      - "7349"
      - "7350"
      - "7351"
      - "2345"
    healthcheck:
      test: ["CMD", "/nakama/nakama", "healthcheck"]
      interval: 10s
      timeout: 5s
      retries: 5
    links:
      - "postgres:db"
    ports:
      - "7349:7349"
      - "7350:7350"
      - "7351:7351"
      - "2345:2345"
      - "4000:4000"
    restart: unless-stopped
    security_opt:
      - "seccomp:unconfined"
    stdin_open: true
    tty: true
volumes:
  data:

VSCode launch.json #

From your Visual Studio Code workspace, add a launch.json file to the .vscode directory as follows:

 1
 2
 3
 4
 5
 6
 7
 8
 9
10
11
12
13
14
15
16
17
18
19
20
21
{
    "version": "0.2.0",
    "configurations": [
        {
            "name": "Delve into Docker",
            "type": "go",
            "request": "attach",
            "mode": "remote",
            "port": 4000,
            "host": "127.0.0.1",
            "showLog": true,
            "debugAdapter": "dlv-dap",
            "substitutePath": [
                { 
                    "from": "<PATH TO GO SOURCE FILES>",
                    "to": "<GO MODULE NAME>"
                },
            ]
        }
    ]
}

The substitutePath:from property should point to the location of your Go files (e.g. ${workspaceFolder}/src/go), and the substitutePath:to property should be set to the name of your Go module as specified in your go.mod file (e.g. heroiclabs.com/nakama-delve-sample).

Debugging and Setting Breakpoints #

With the above changes in place, go to the Run and Debug view in VS Code by clicking the button shown below.

Run and Debug button

Breaking before the module loads #

If you need to debug code that runs as soon as your module is loaded (e.g. code inside your InitModule function) then you need to set a breakpoint in Nakama itself before it loads your module. If you do not need to do this, feel free to launch the debugger now (by clicking the play button shown below) and then skip to the next section.

For this, go to the Breakpoints section in VSCode, click on the + button and add a breakpoint to Nakama’s main.go file on an appropriate line, such as 181, by typing main.go:181 and hit enter.

Setting a breakpoint in Nakama’s main.go before your module loads

You can now launch the debugger by clicking the play button at the top of the Run and Debug panel.

Click the play button to start debugging

At this point, Nakama should run and VS Code should stop at the breakpoint set. You will see the Variables panel on the left populated with the local variables as of main.go:181.

You may also see the following error:

Could not load source 'github.com/heroiclabs/nakama/v3/main.go': Unsupported command: cannot process "source" 

You can safely ignore this. This is just VS Code telling us that it doesn’t know anything about Nakama’s main.go file and therefore it can’t show us the code we are debugging right now.

Breaking on an RPC #

Now let’s say we want to debug a call to an RPC. In the following example, we have registered an RPC inside the InitModule function. The function name of the RPC is SomeRpc.

In order to add a breakpoint, again click the + symbol in the Breakpoints panel and type the name of the function, in this case SomeRpc.

Adding a breakpoint on the RPC function name

It is currently not possible to add breakpoints on line numbers directly using the VS Code breakpoint line toggle. You must instead enter your breakpoints directly in the Breakpoint panel as described above.

Now click on the Continue button in the debug tools panel to allow Nakama to continue execution.

Click the Continue button to continue execution of Nakama

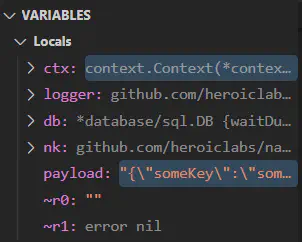
We now need to trigger the RPC. We can do this either by calling it from a client or by visiting the Nakama Console in a browser and using the API explorer. Once the RPC has been triggered, you should see that VS Code successfully hits the breakpoint and you can now use the standard debugging tools (e.g. Variables, Locals, Step Into, Step Over etc) as you would expect.

The RPC breakpoint being hit in VS Code
The populated variables panel showing the incoming RPC payload