ARM users
Using Delve on ARM architecture is unstable, consider debugging with another architecture.

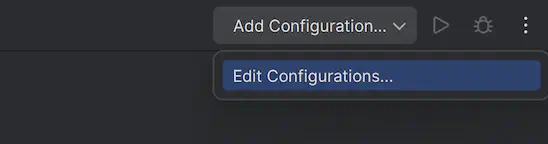
Using GoLand Debugger #

With some minor modifications to the directions in the Debugging with Delve guide, you can debug your custom Go server runtime code using Delve inside a Docker container via GoLand.

Due to some limitations of the GoLand Debugger, you must install the Dlvx Plugin. To do this, go to GoLand > Settings > Plugins > Search for “Dlvx” > Press Install.

Dockerfile #

The same Dockerfile is used, with the only change being the removal of the ENTRYPOINT line:

 1
 2
 3
 4
 5
 6
 7
 8
 9
10
11
12
13
14
15
16
17
FROM heroiclabs/nakama-pluginbuilder:3.22.0 AS builder

ENV GO111MODULE on
ENV CGO_ENABLED 1
ENV GOPRIVATE "hiro/guides"

WORKDIR /backend
COPY . .

RUN go build --trimpath --gcflags "all=-N -l" --buildmode=plugin -o ./backend.so
RUN go install github.com/go-delve/delve/cmd/dlv@latest

FROM heroiclabs/nakama-dsym:3.22.0

COPY --from=builder /go/bin/dlv /nakama
COPY --from=builder /backend/backend.so /nakama/data/modules
COPY --from=builder /backend/local.yml /nakama/data/

Docker Compose file #

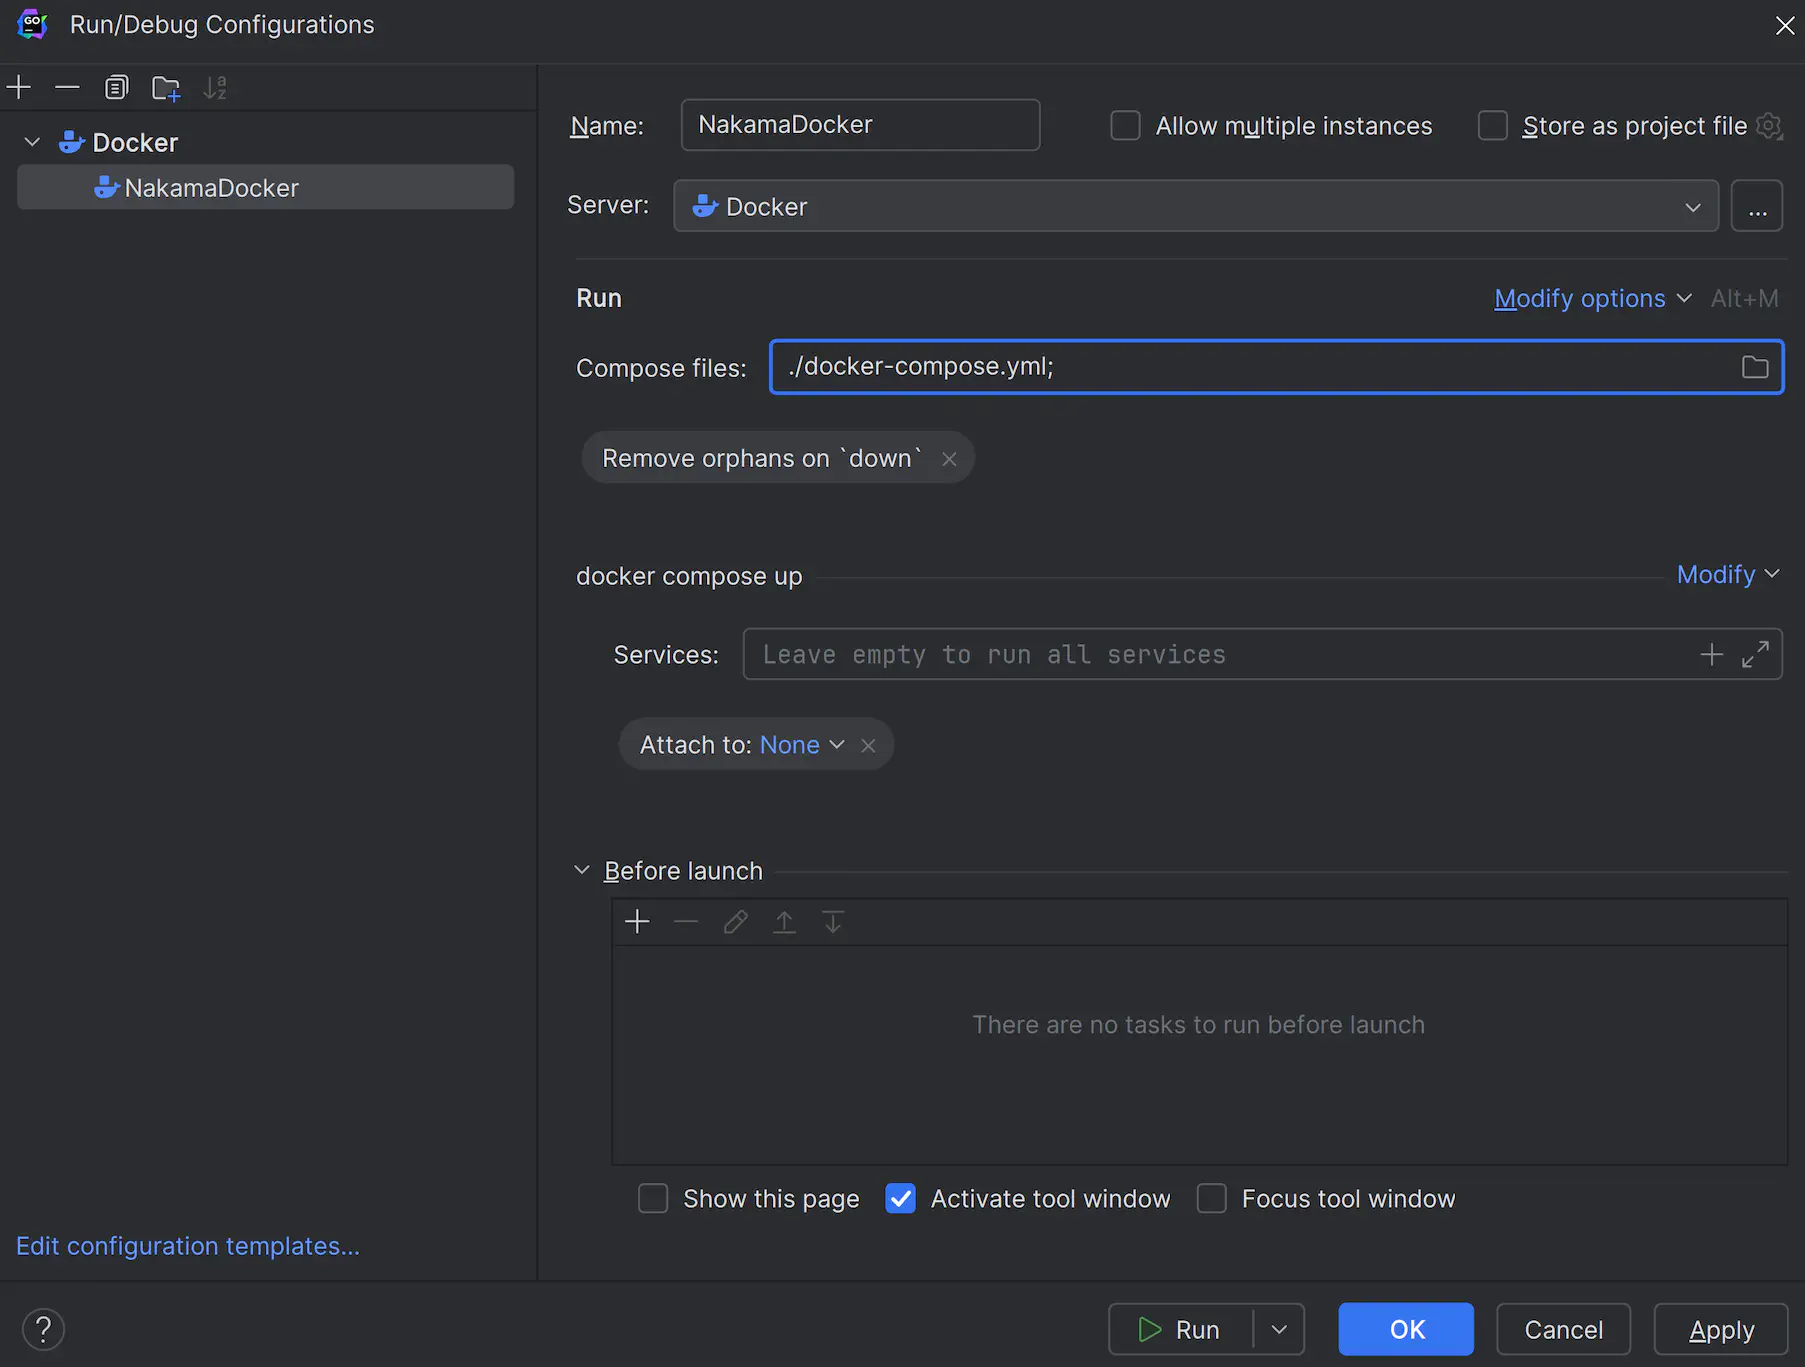
In the Docker Compose file, we add the entrypoint property to the nakama server and set it to run the container using the dlv command. We also add the Delve port (4000) to the ports property.

 1
 2
 3
 4
 5
 6
 7
 8
 9
10
11
12
13
14
15
16
17
18
19
20
21
22
23
24
25
26
27
28
29
30
31
32
33
34
35
36
37
38
39
40
41
42
43
44
45
46
47
48
49
50
51
52
53
54
55
56
57
58
59
version: '3.9'
services:
  postgres:
    container_name: game_backend_postgres
    command: postgres -c shared_preload_libraries=pg_stat_statements -c pg_stat_statements.track=all
    environment:
      - POSTGRES_DB=nakama
      - POSTGRES_PASSWORD=localdb
    expose:
      - "8080"
      - "5432"
    healthcheck:
      test: [ "CMD", "pg_isready", "-U", "postgres", "-d", "nakama" ]
      interval: 3s
      timeout: 3s
      retries: 5
    image: postgres:12.2-alpine
    ports:
      - "5432:5432"
      - "8080:8080"
    volumes:
      - data:/var/lib/postgresql/data

  nakama:
    build: .
    container_name: game_backend
    entrypoint:
      - "/bin/sh"
      - "-ecx"
      - >
        /nakama/nakama migrate up --database.address postgres:localdb@postgres:5432/nakama &&
        /nakama/dlv --log --log-output=debugger --listen=:4000 --headless=true --api-version=2 exec nakama -- --config /nakama/data/local.yml --database.address postgres:localdb@postgres:5432/nakama        
    depends_on:
      postgres:
        condition: service_healthy
    expose:
      - "7349"
      - "7350"
      - "7351"
    healthcheck:
      test: ["CMD", "/nakama/nakama", "healthcheck"]
      interval: 10s
      timeout: 5s
      retries: 5
    links:
      - "postgres:db"
    ports:
      - "7349:7349"
      - "7350:7350"
      - "7351:7351"
      - "2345:2345"
      - "4000:4000"
    restart: unless-stopped
    security_opt:
      - "seccomp:unconfined"
    stdin_open: true
    tty: true
volumes:
  data:

Setting GoLand Configurations #

  1. Open GoLand Run/Debug Configurations by pressing Add Configuration… -> Edit Configurations…

Opening GoLand Run/Debug Configurations

  1. Add a Dockerfile configuration to run the nakama server:

Adding Docker Configurations

Docker Configurations

  1. Add a Go Remote configuration and set the correct port:

Adding Go Remote Configurations

Go Remote Configurations

Debugging and Setting Breakpoints #

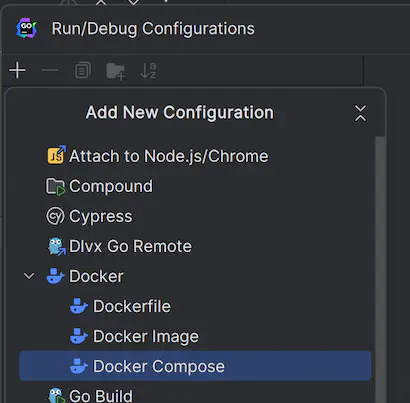
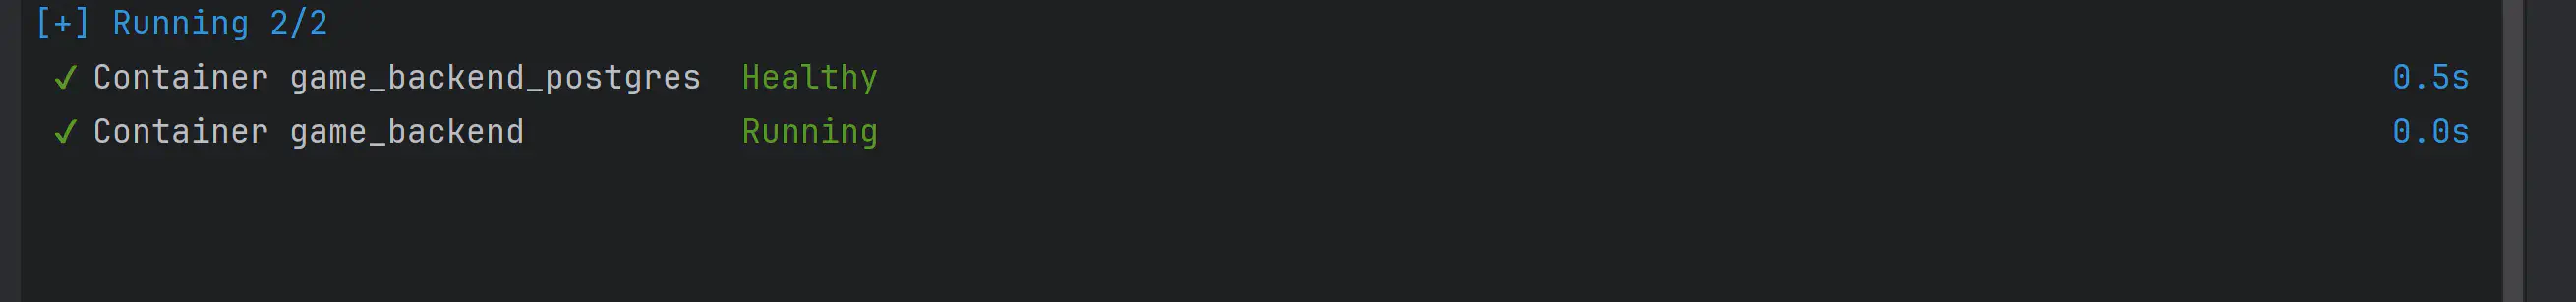
With the above changes in place, select the Docker Configuration and run it by clicking the start button. 
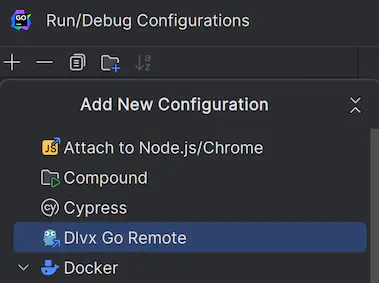
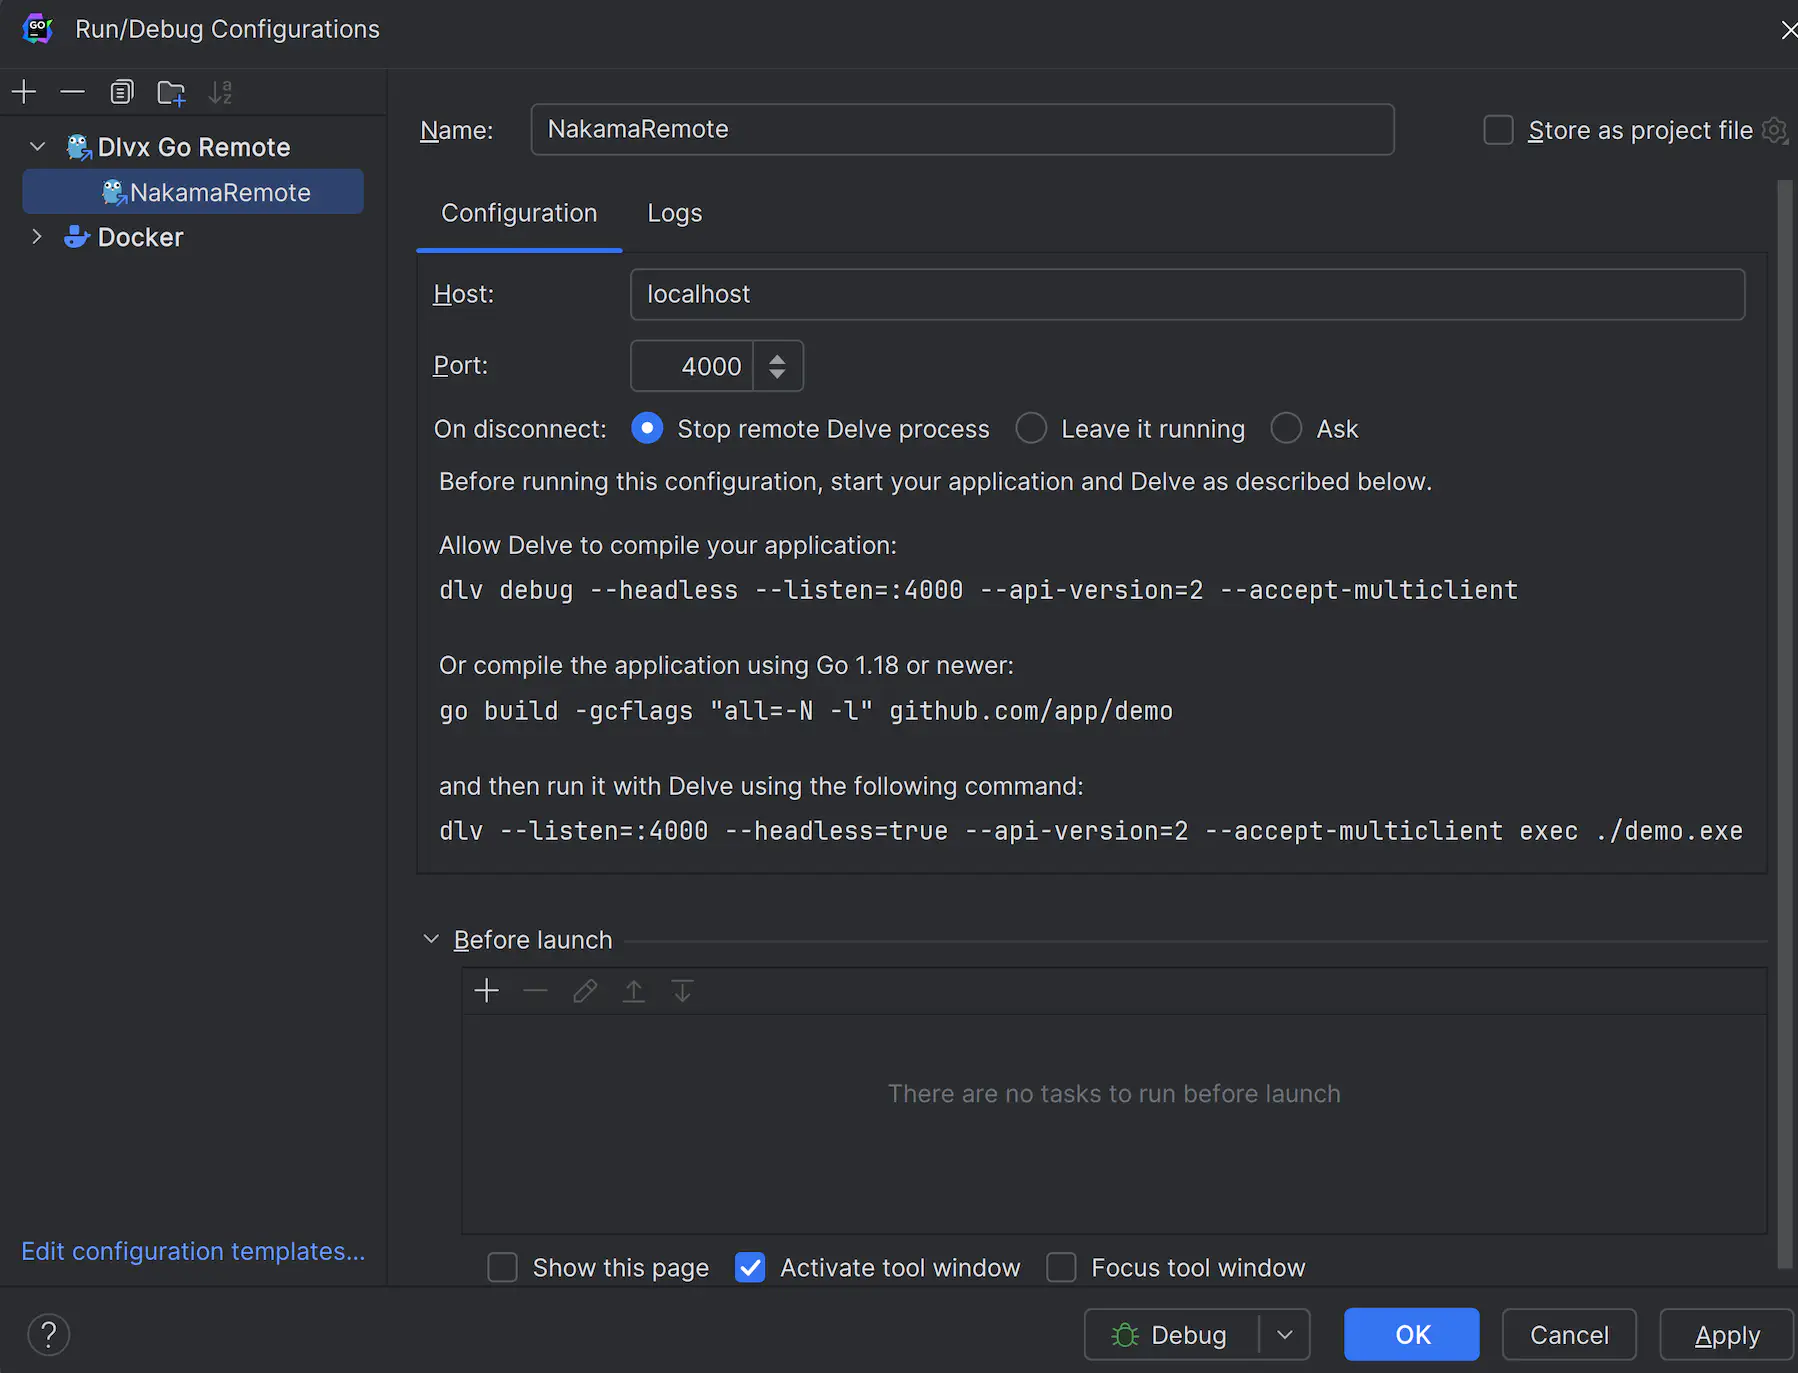
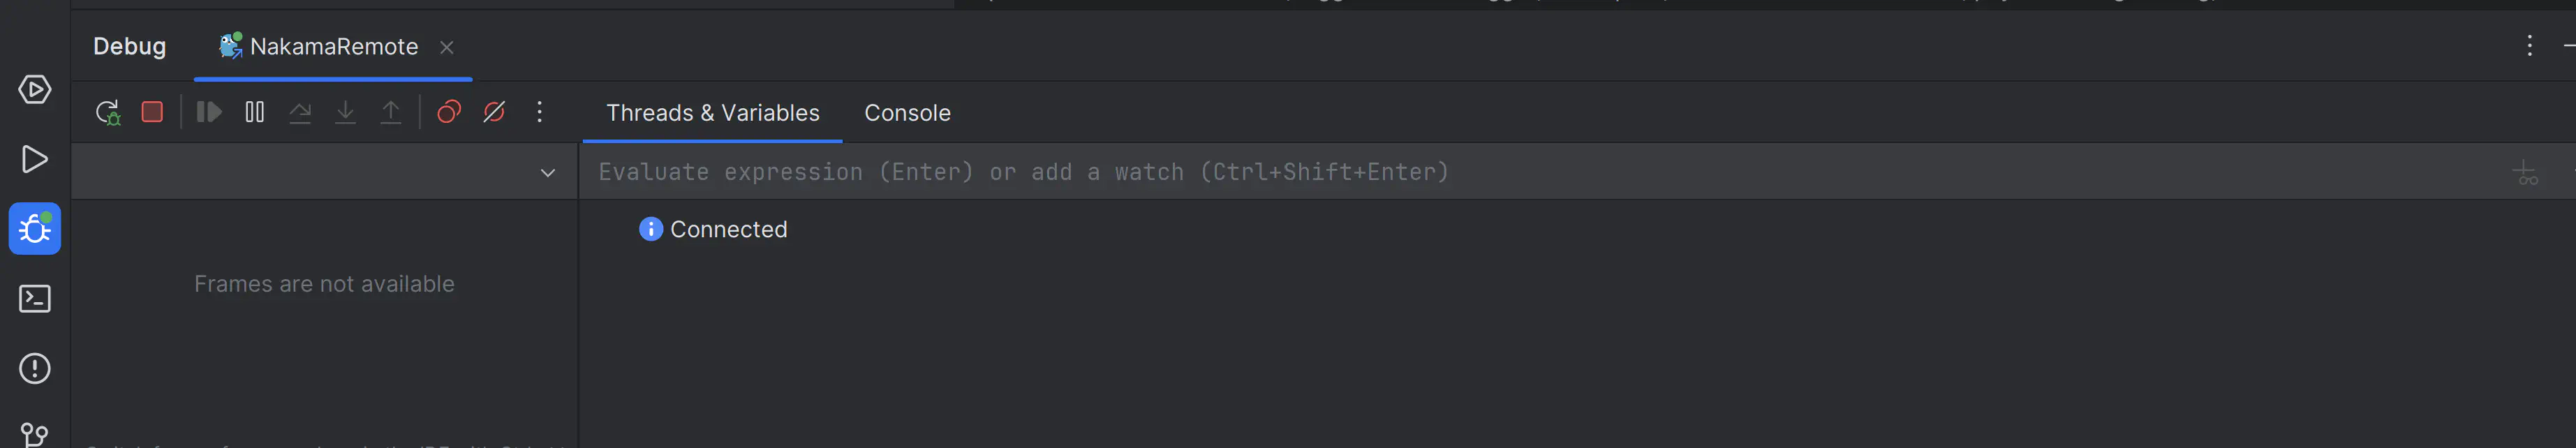
Once Docker finishes the startup, run the Go Remote Configuration:

Docker Running
Docker Running

Go Remote Running
Go Remote Running

After the Nakama server is running you can set Go Function Breakpoints and debug from there.

Breaking on an RPC #

In the following example we have registered an RPC SomeRpc inside the InitModule function.

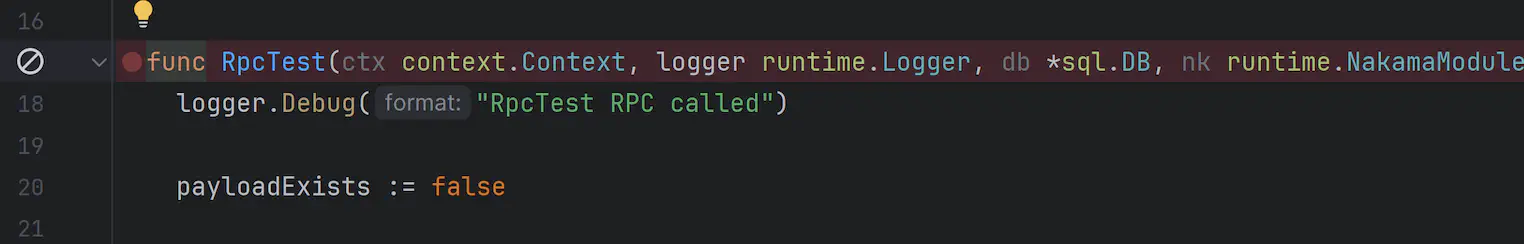
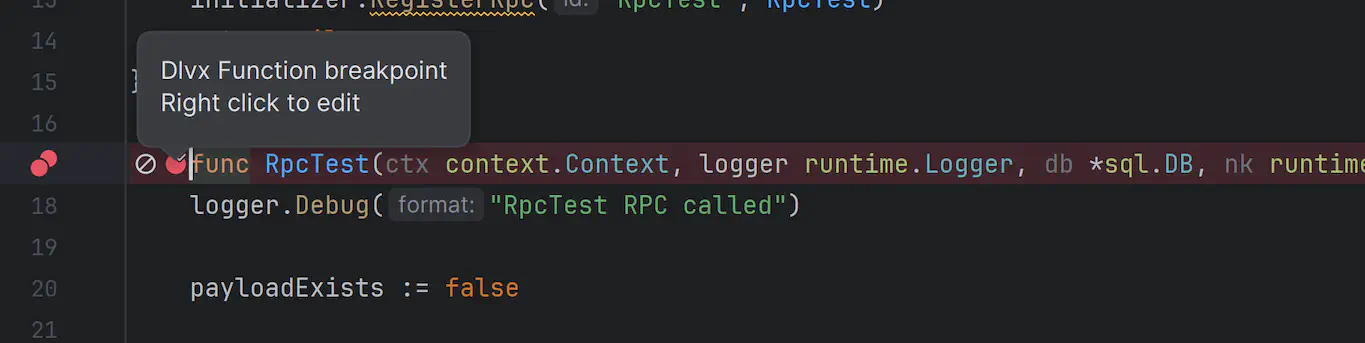
In order to add a breakpoint, press the red circle right next to the line number you want to add the breakpoint.

Setting first breakpoint

After doing this, a faded red circle will appear next to the function name, press that also.

Setting Go Function breakpoint

It is currently not possible to add breakpoints to lines of code that are not function signatures using the GoLand’s breakpoint line toggle.

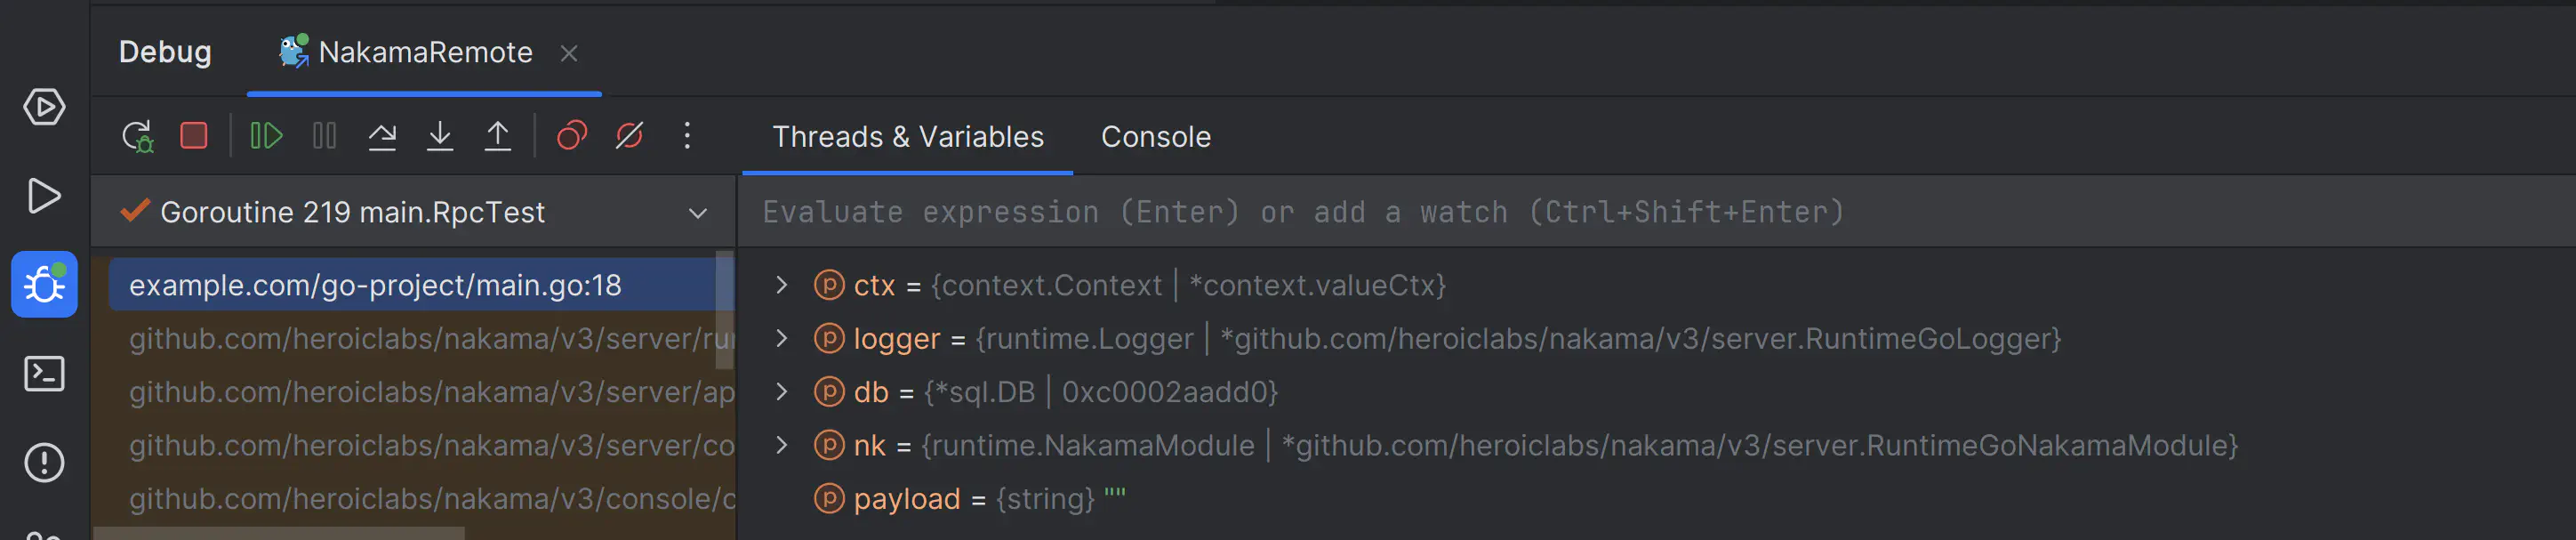
We now need to trigger the RPC. We can do this either by calling it from a client or by visiting the Nakama Console in a browser and using the API Explorer.

Once the RPC has been triggered, you should see that Goland successfully hits the breakpoint and you can now use the standard debugging tools (e.g. Variables, Locals, Step Into, Step Over etc).

Goland Debbuger
Goland Debbuger