Dashboard metrics and logs
Each Nakama deployment includes built-in graphs and logs. Use these to monitor health, spot issues, and investigate incidents before they affect players.
Overview #
The Graphs tab gives you time-series performance data. The Logs tab gives you deployment output in UTC. Both support filtering, searching, and exporting. These built-in tools are useful for day-to-day monitoring. For integration with your own observability stack, see the log exporting and metric exporting add-ons.
Graphs #
What to watch #
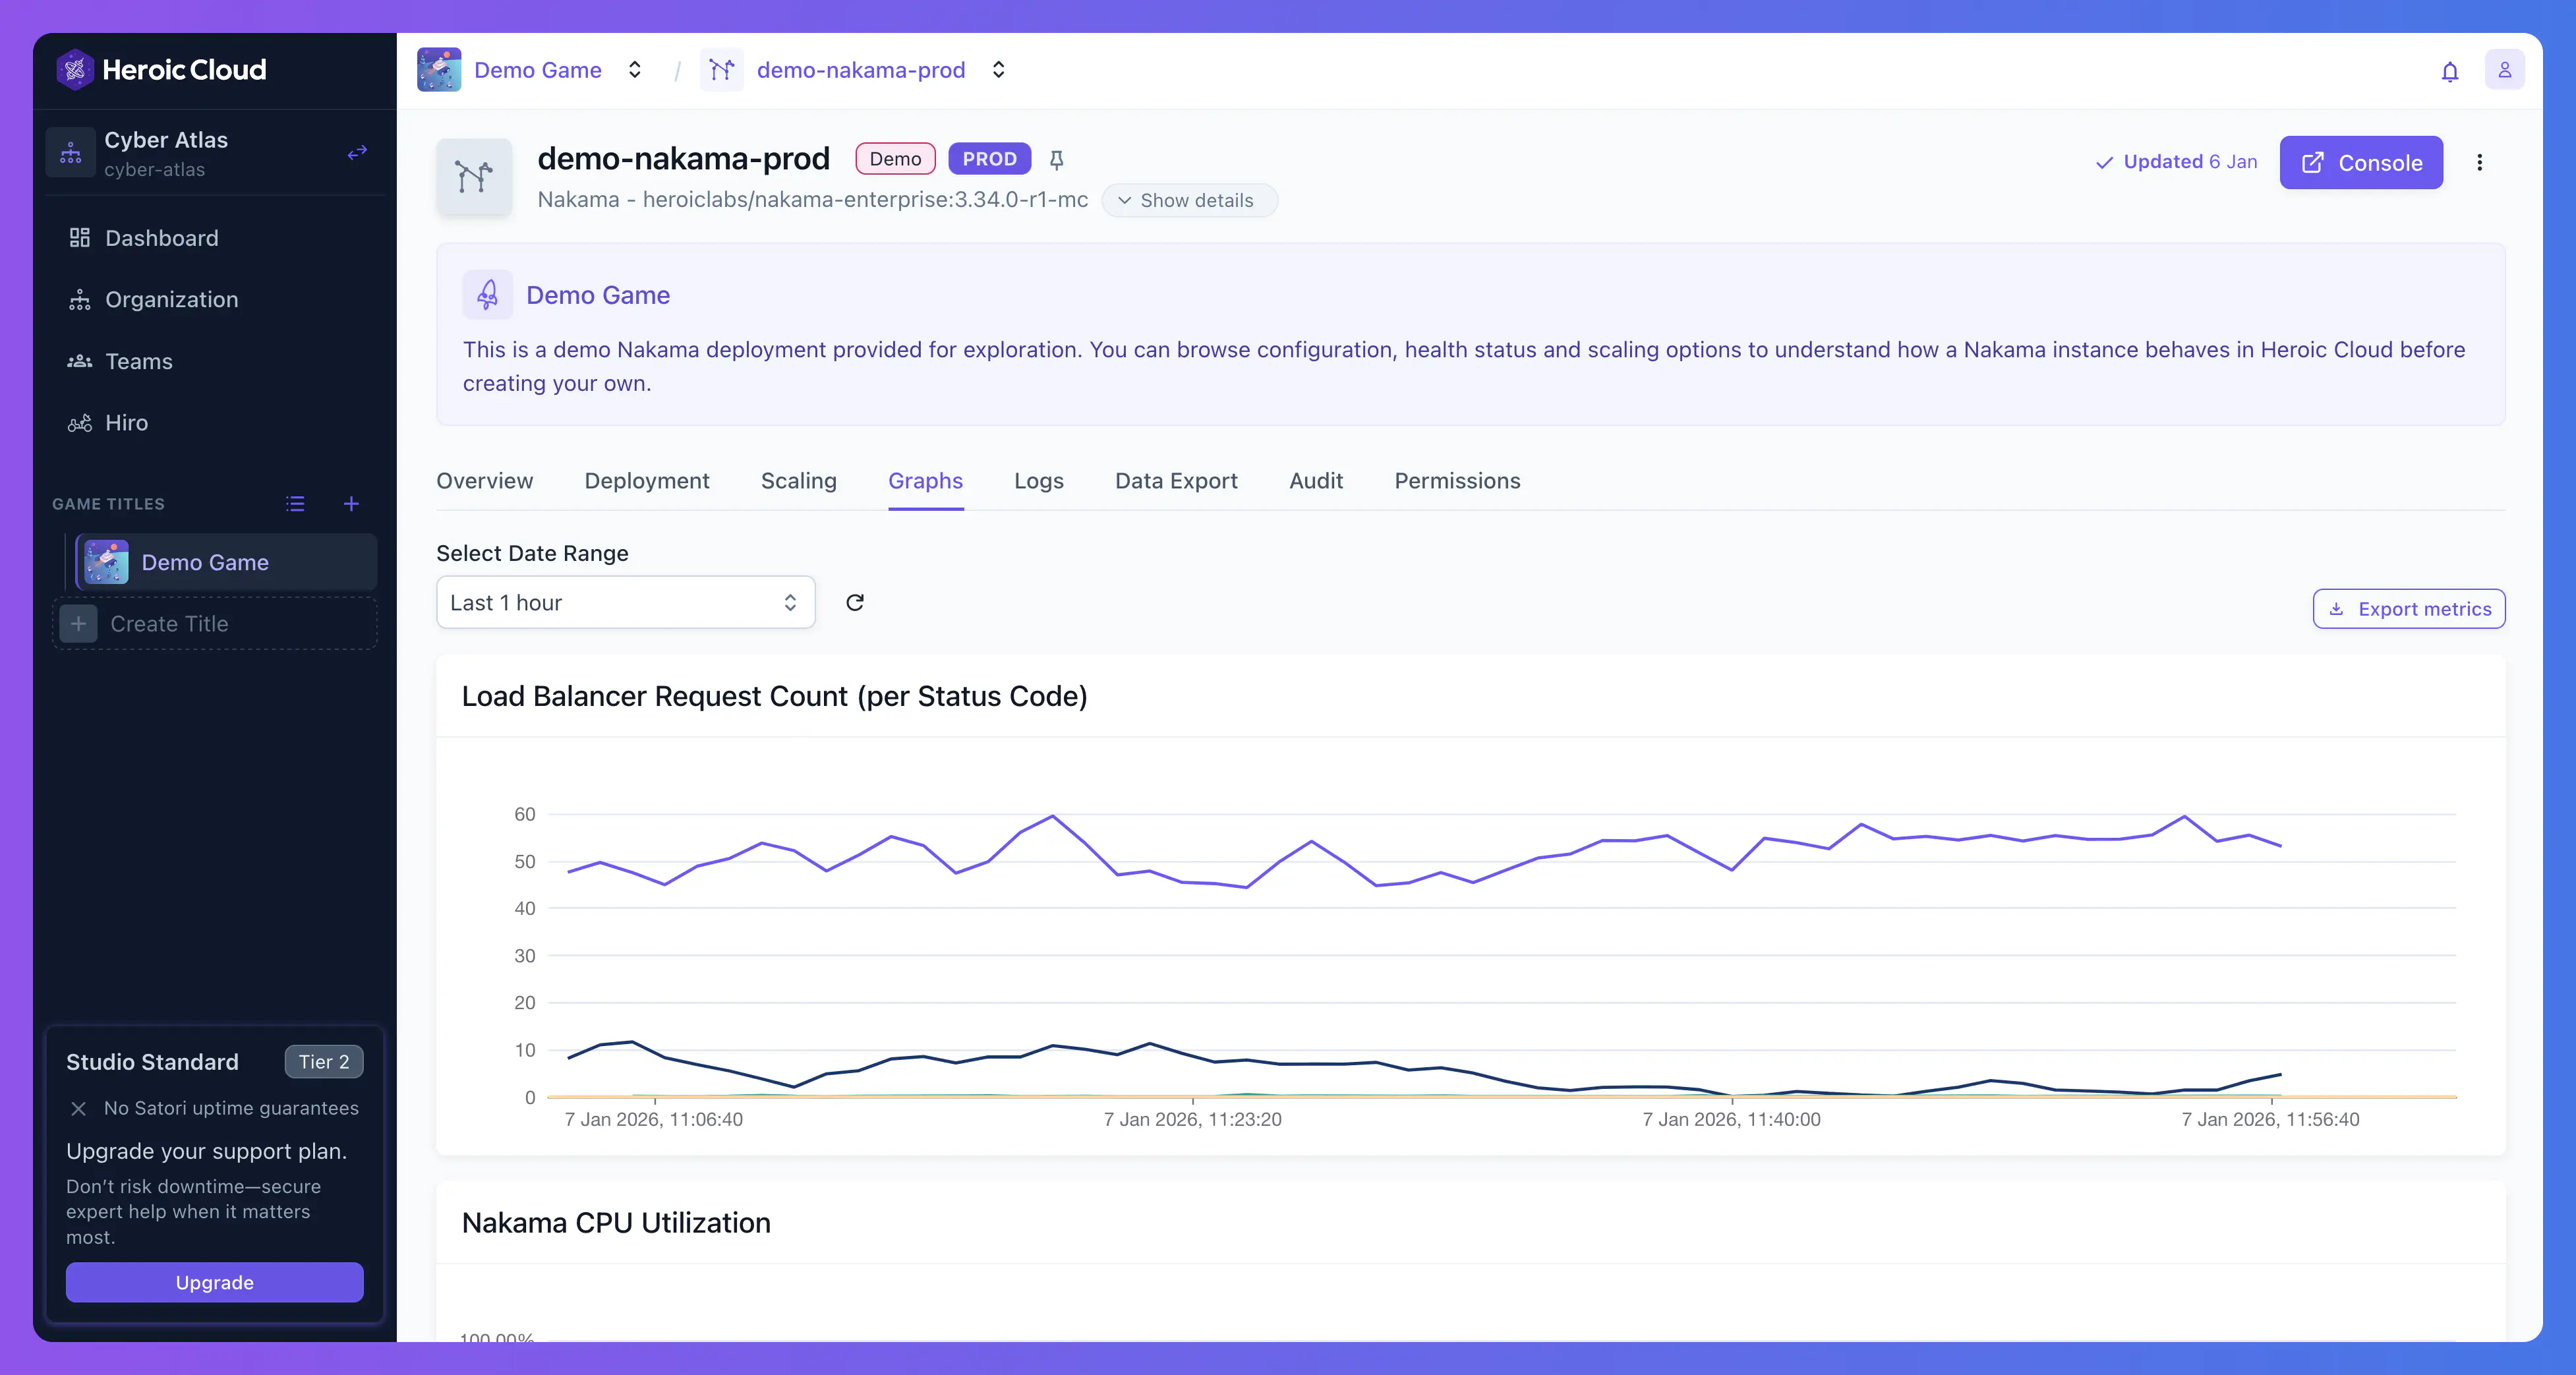
- Load Balancer Request Count (per status code) shows HTTP request volume broken down by 2xx, 4xx, and 5xx. A sudden spike in 5xx errors means something is wrong on the server side. A spike in 4xx may indicate client-side issues or rate limiting.
- Nakama CPU Utilization shows CPU usage per node (for example, nakama-0, nakama-1). If any node consistently exceeds 70-80%, consider scaling up. Uneven utilization across nodes may indicate a load balancing issue.
- Nakama Memory Utilization shows memory usage per node. Watch for gradual increases that could indicate a memory leak in your game module.
- Database CPU Utilization shows CPU usage for your PostgreSQL database. High sustained usage suggests you need a larger database tier or query optimization.
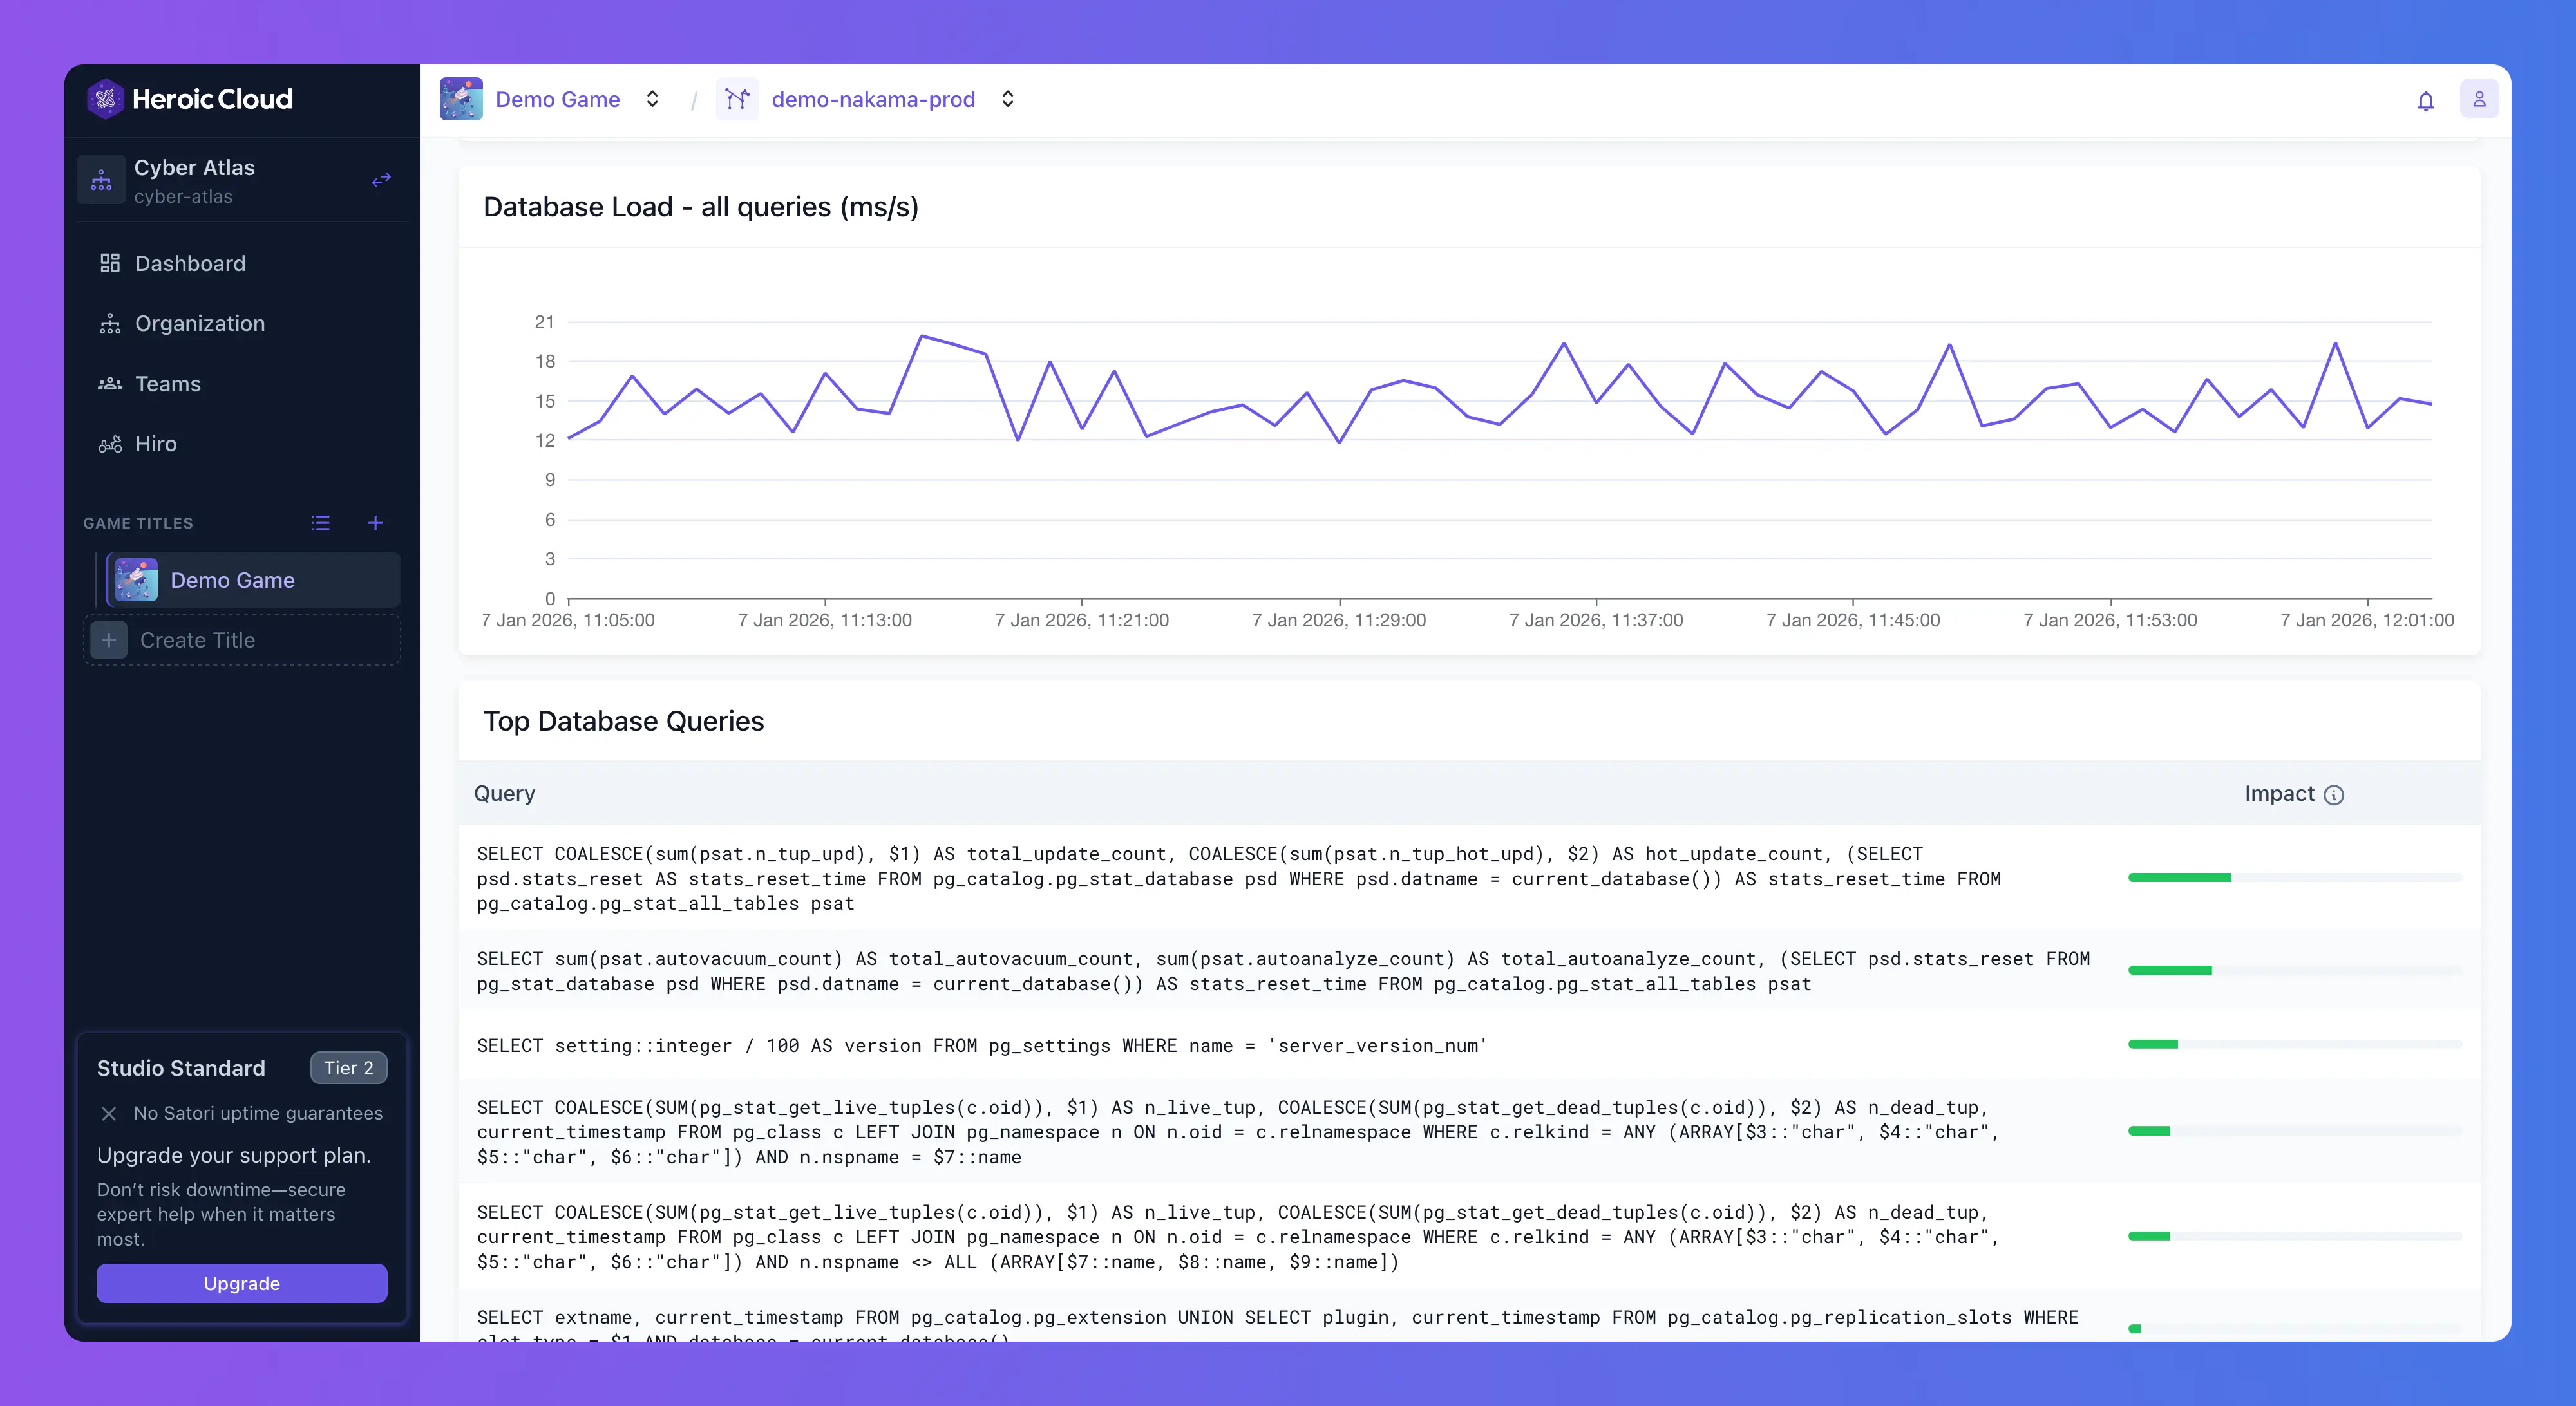
- Database Load - all queries (ms/s) shows total query execution time per second. Useful for spotting workload trends over time.
Top database queries #
Below the charts, the Top Database Queries section lists the most resource-intensive SQL queries. Each query has an Impact indicator (colored bar). If your database CPU is high, start here to identify which queries need optimization.
Date range and export #
Choose a date range (for example, Last 1 hour) and select the refresh icon to reload. The Export metrics button downloads data for the selected range, useful for sharing with your team or importing into external tools.
Logs #
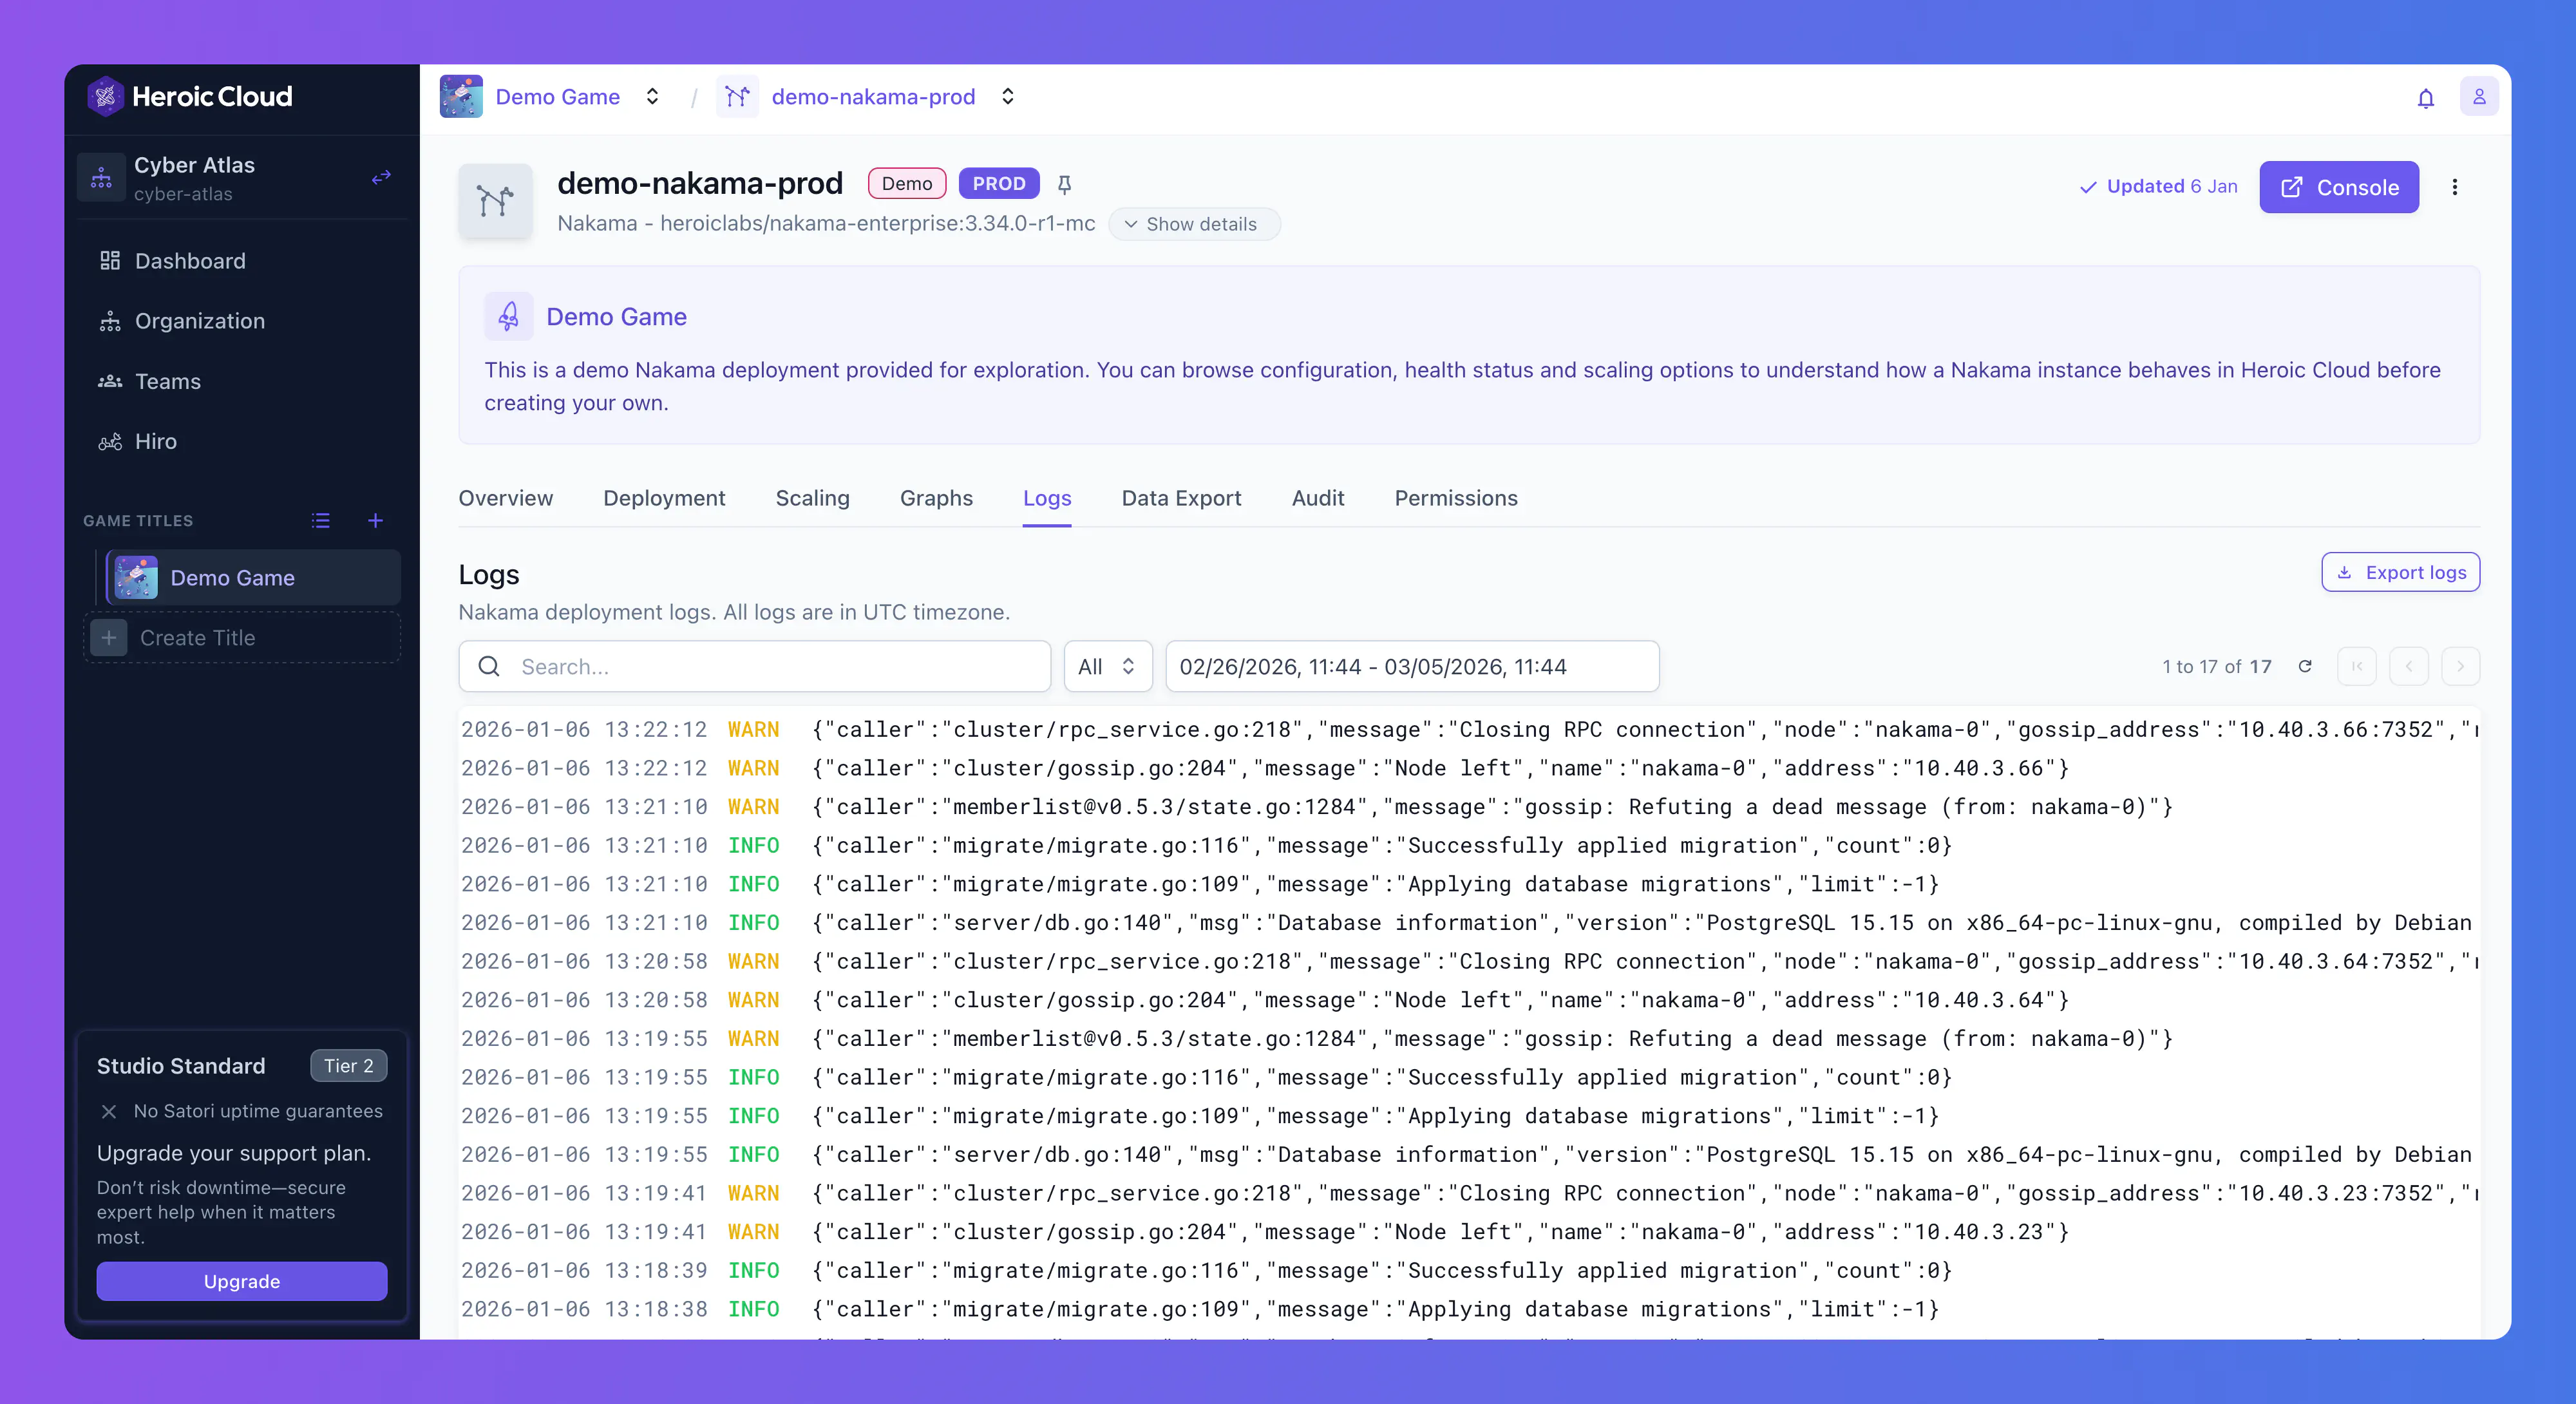
All logs display in UTC, regardless of your local timezone or your deployment’s region.
Searching and filtering #
Use the search bar to find logs by keyword. Filter by severity using the level dropdown (default: All). The date range picker narrows to a specific window. Pagination controls navigate through pages.
Exporting logs #
Select Export logs to download logs matching your current filters. This is a one-time download of the visible logs. For continuous shipping to your own infrastructure, see Log exporting.
Deployment-level audit log #
Each deployment also has its own Audit tab, separate from the organization-level audit. This scoped log shows all user actions on that specific deployment: who deployed an image, who changed configurations, who triggered a reboot. See Audit log for details on categories and filtering.
