Analytics Dashboards, Reimagined

Satori’s reimagined analytics dashboards give you a single place to oversee all your live operations.
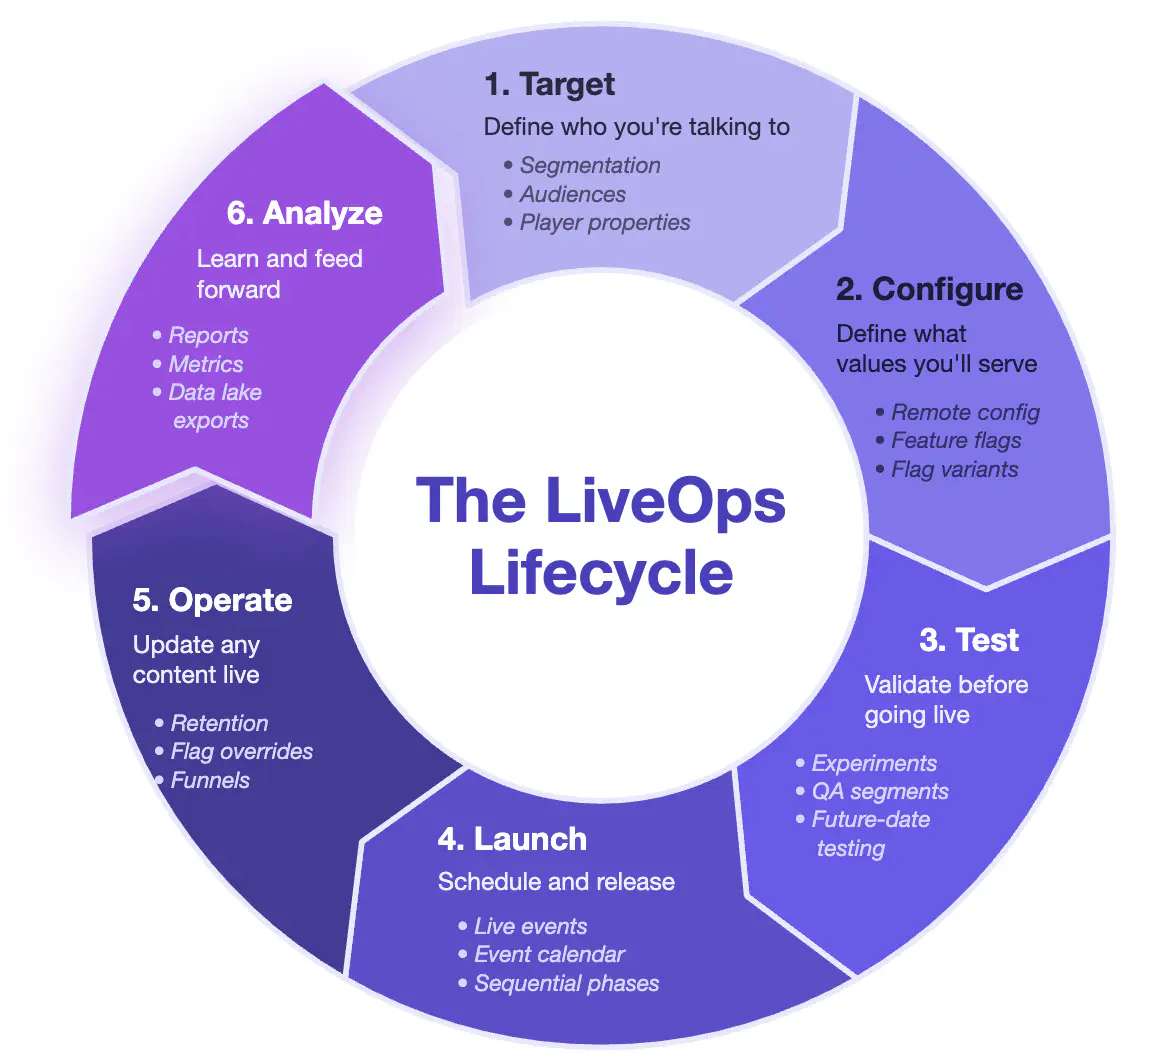
Satori is Heroic’s LiveOps platform for running experiments, live events, and player segmentation. Satori ingests analytic events from your game client at high throughput. Each event updates event-derived player properties, which in turn drive player segment membership. You can tailor your game content and player messaing by attaching a custom segment to any configuration.
From the start, we built Satori as an integrated platform: run live operations, ingest player events, and measure results against real time data. Analytics dashboards are the next step in that vision. Every chart reads the live player data stream. You’ll know how well your A/B test experiment went without hopping to another tool.
Here are some of the key features.
See what’s live and who’s playing
Satori ships with two built-in dashboards: Status and Game Metrics.
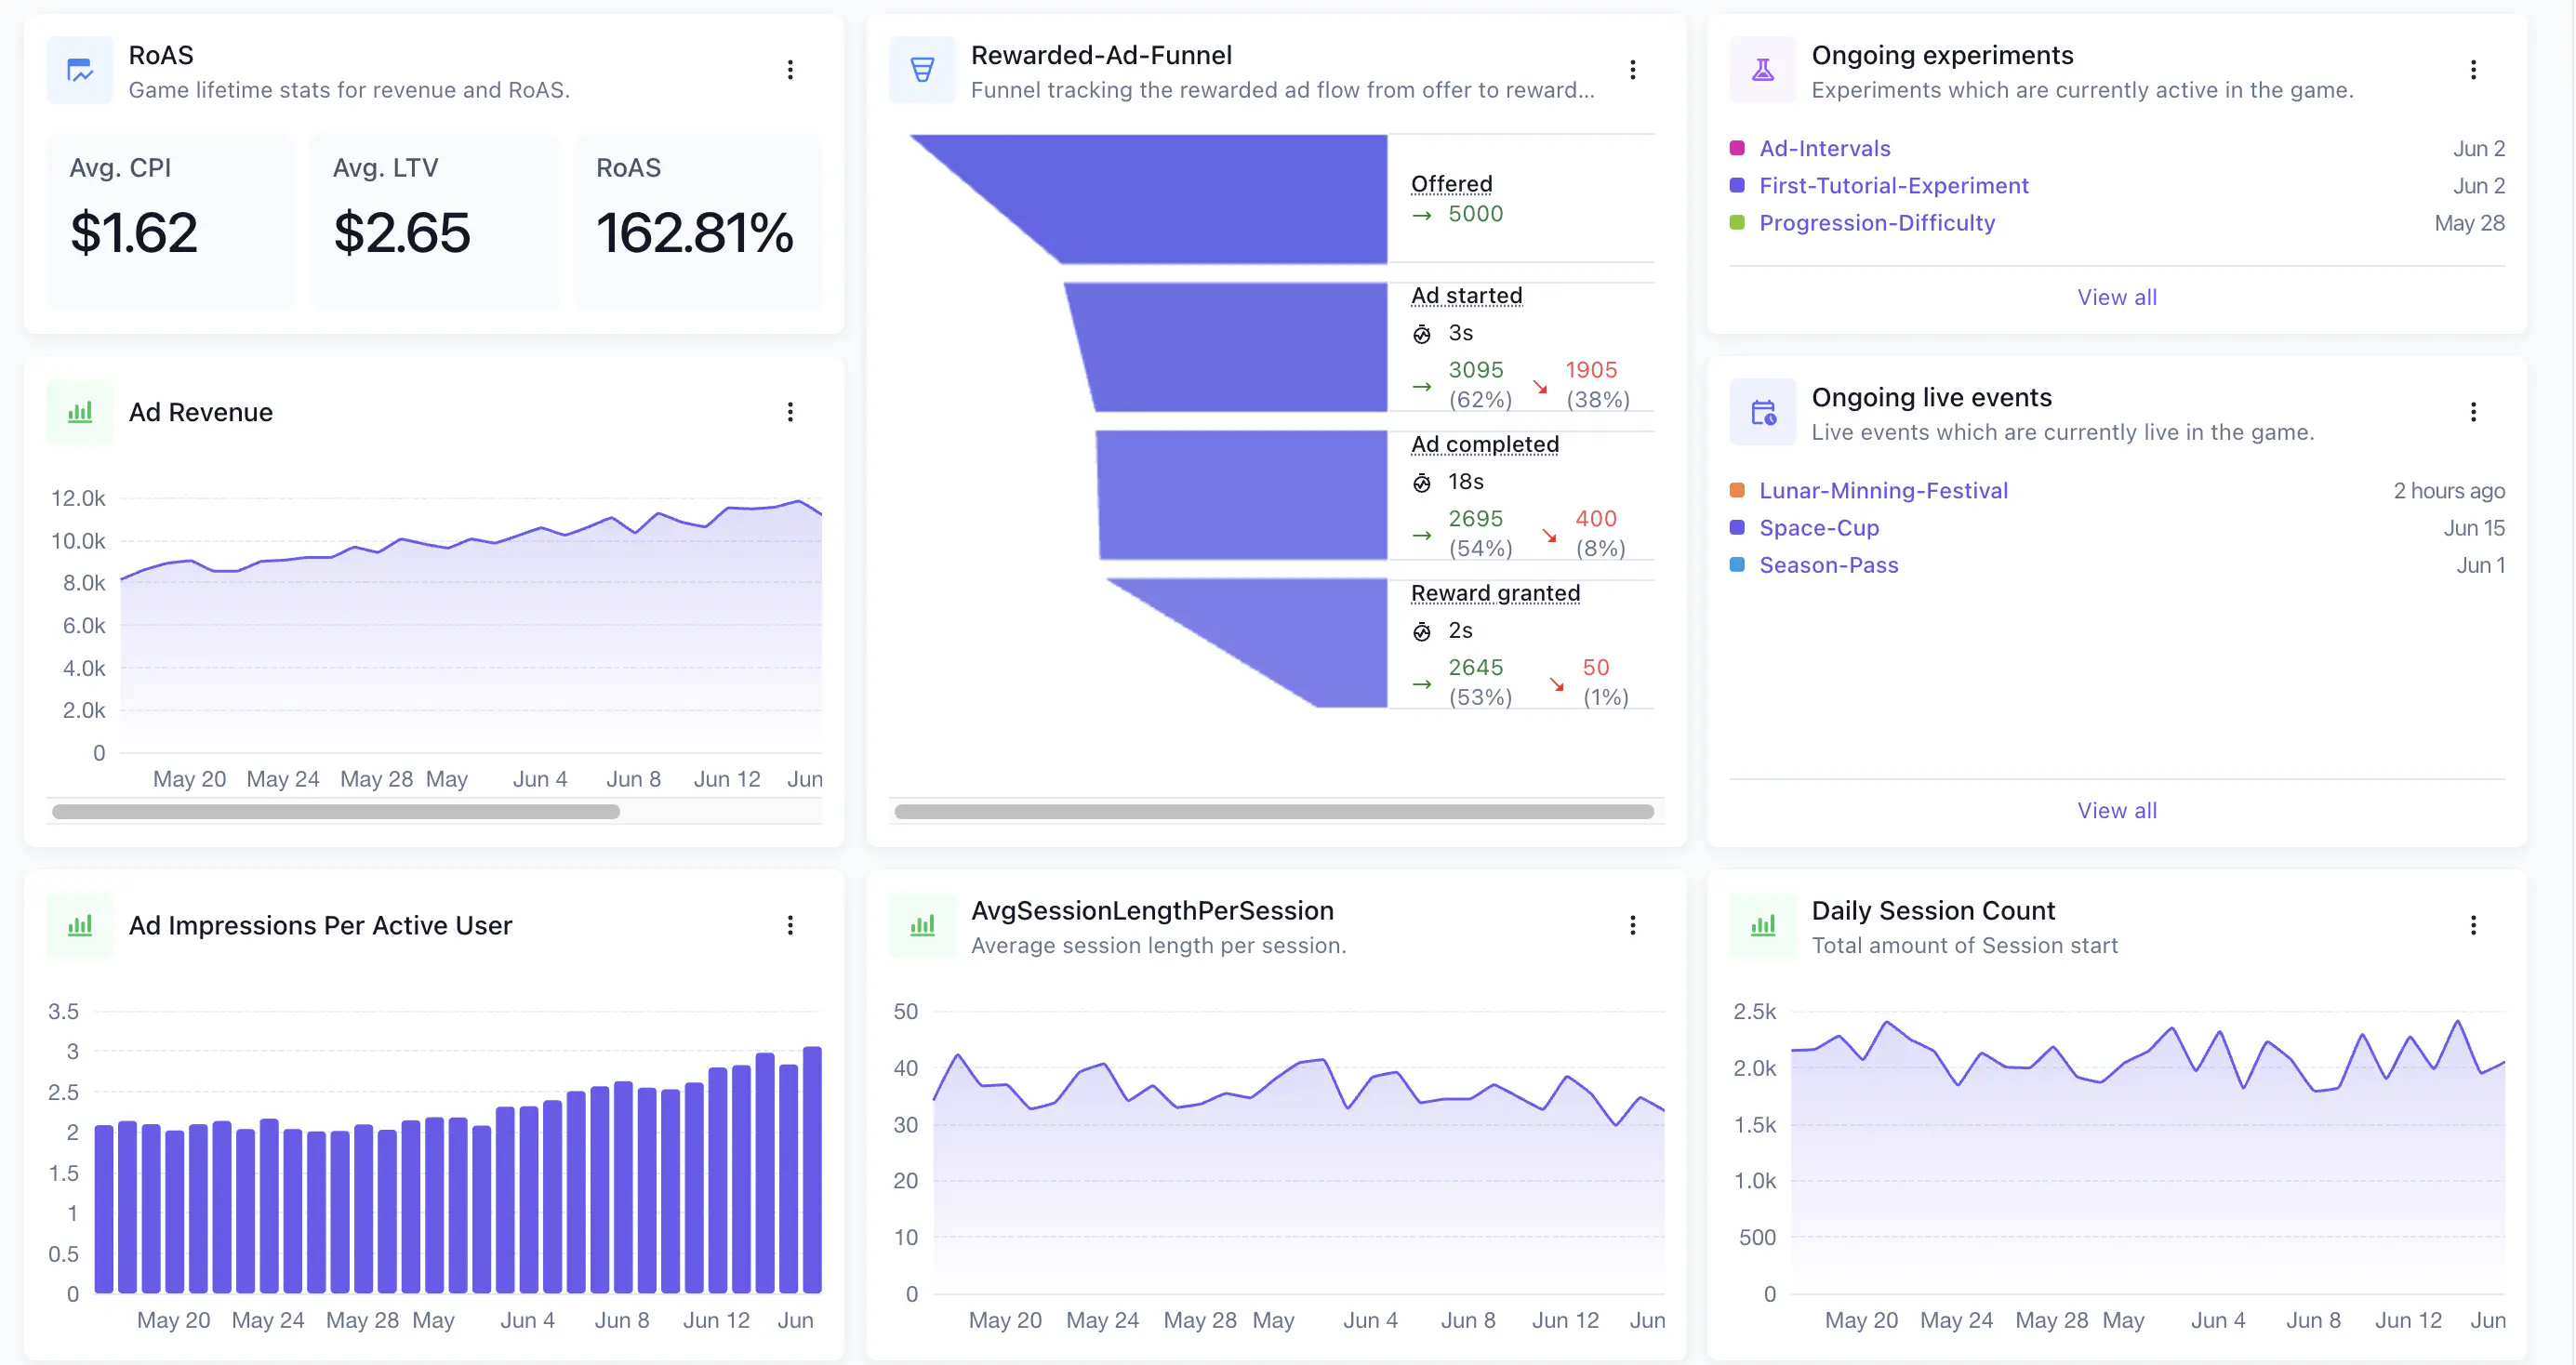
The Status dashboard gives you a birds-eye view of your live operations: who’s playing, what’s running, and what’s scheduled next. Click into any widget to see details.
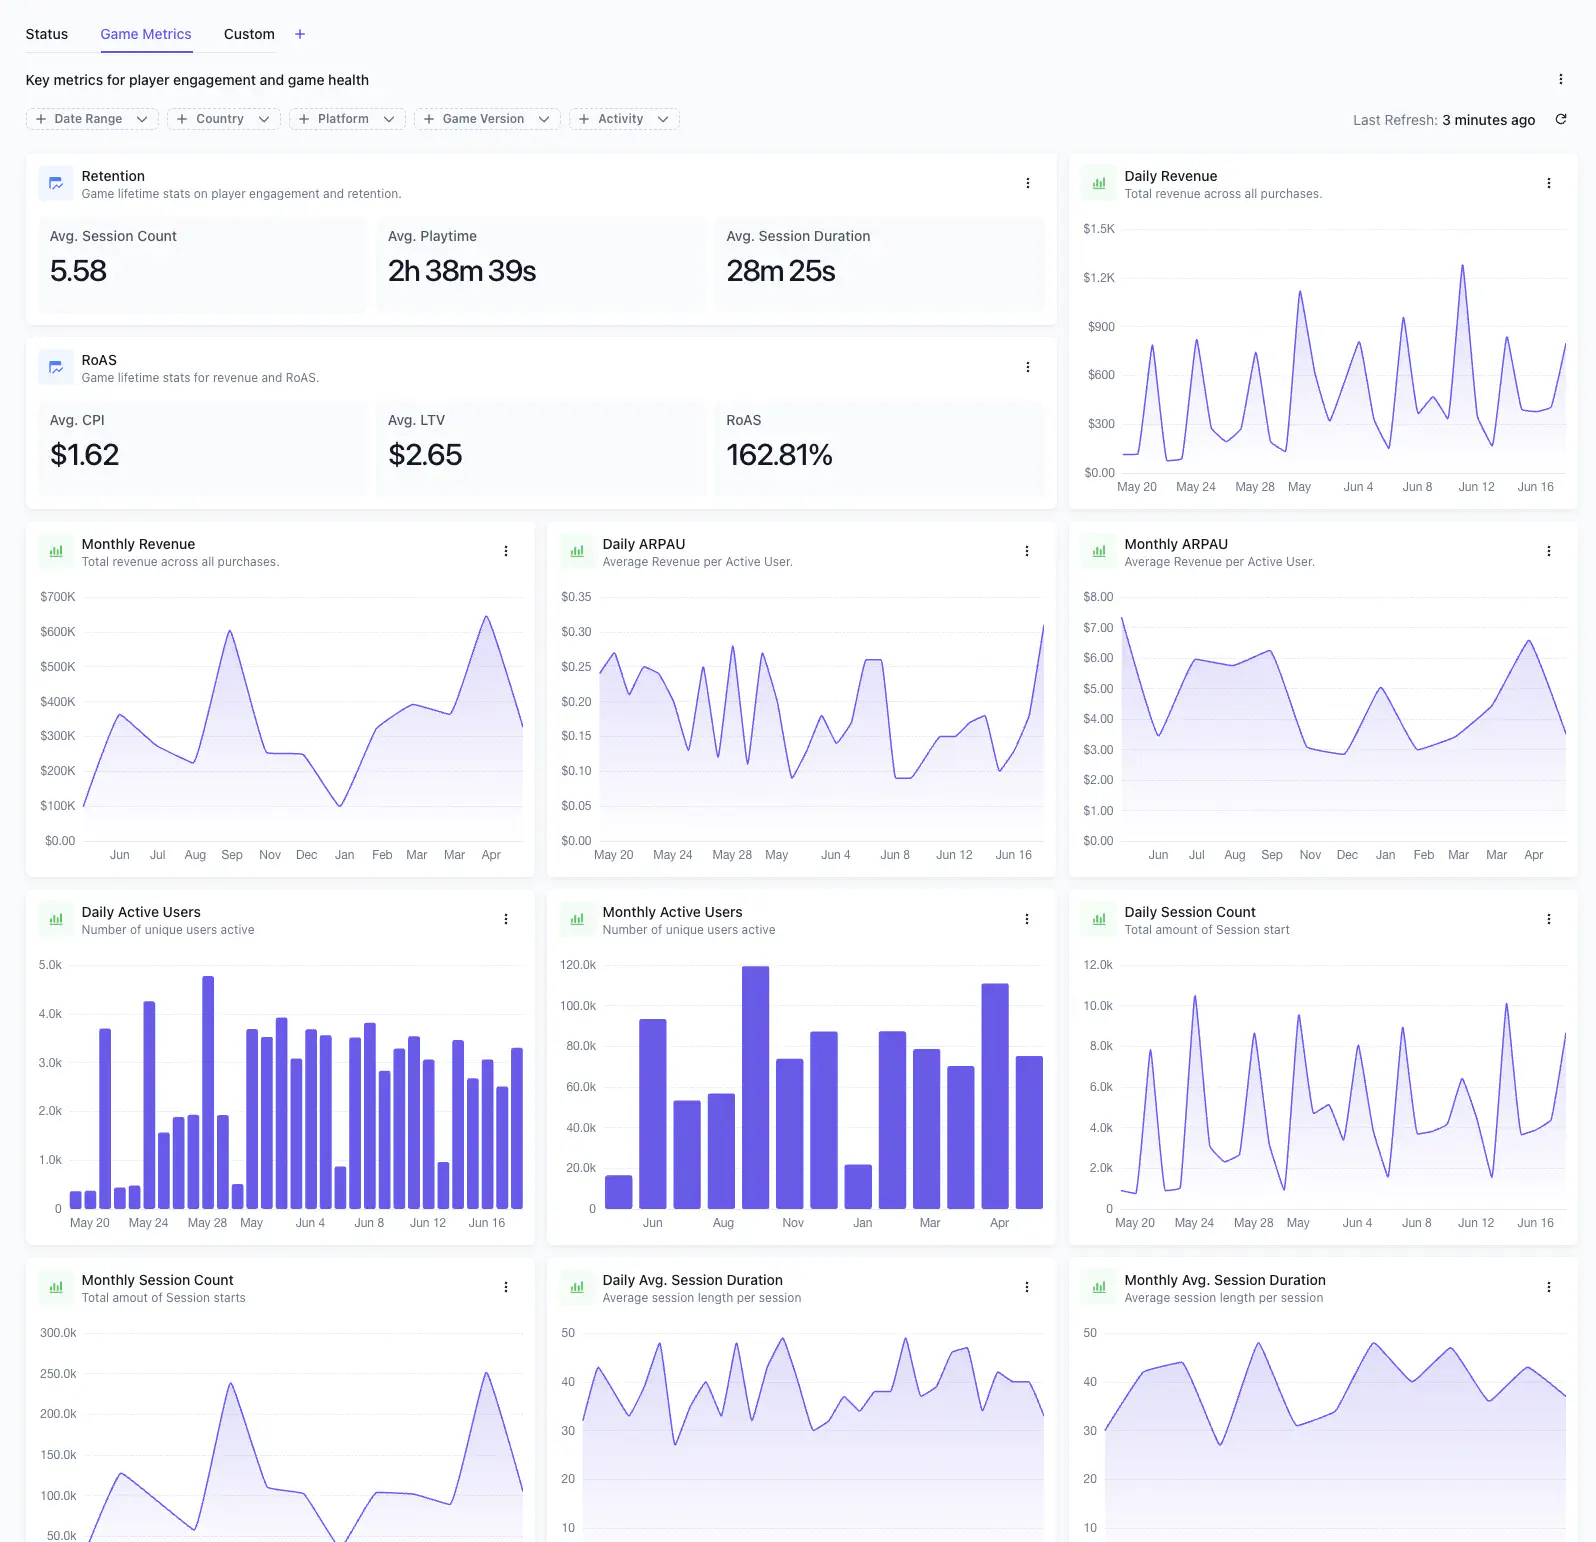
Track how your game is doing
The Game Metrics dashboard goes deeper. We’ve included built-in metrics like retention, session depth, RoAS, ARPDAU, and revenue that work from day one with no setup.
Slice your data to compare what worked
Filter charts by geography, platform, or game version to spot regional trends or version-specific issues. Scope a chart to a specific live event or experiment variant to see exactly which variant drove the results you care about.
Build a custom view for every goal
Beyond the built-in dashboards, you can create custom ones. Add widgets for Metrics, Live Events, Experiments, Funnels, Retention, RoAS, and Errors. Each widget renders on your real data as you drop it.
When you need to measure something specific to your game, you can create your own custom metrics tied to any analytic event your game tracks. Define a metric once and it becomes available as a goal or monitor metric across every experiment, live event, and dashboard.

We’ve made dashboards shared by default, so the views one person builds are available to the whole team. A UA manager builds a view tracking ad revenue and impressions. A game designer builds one with tutorial funnels and retention. Build it once, and everyone reaches for it next time.
Drag and stretch any widget to get the arrangement just right.
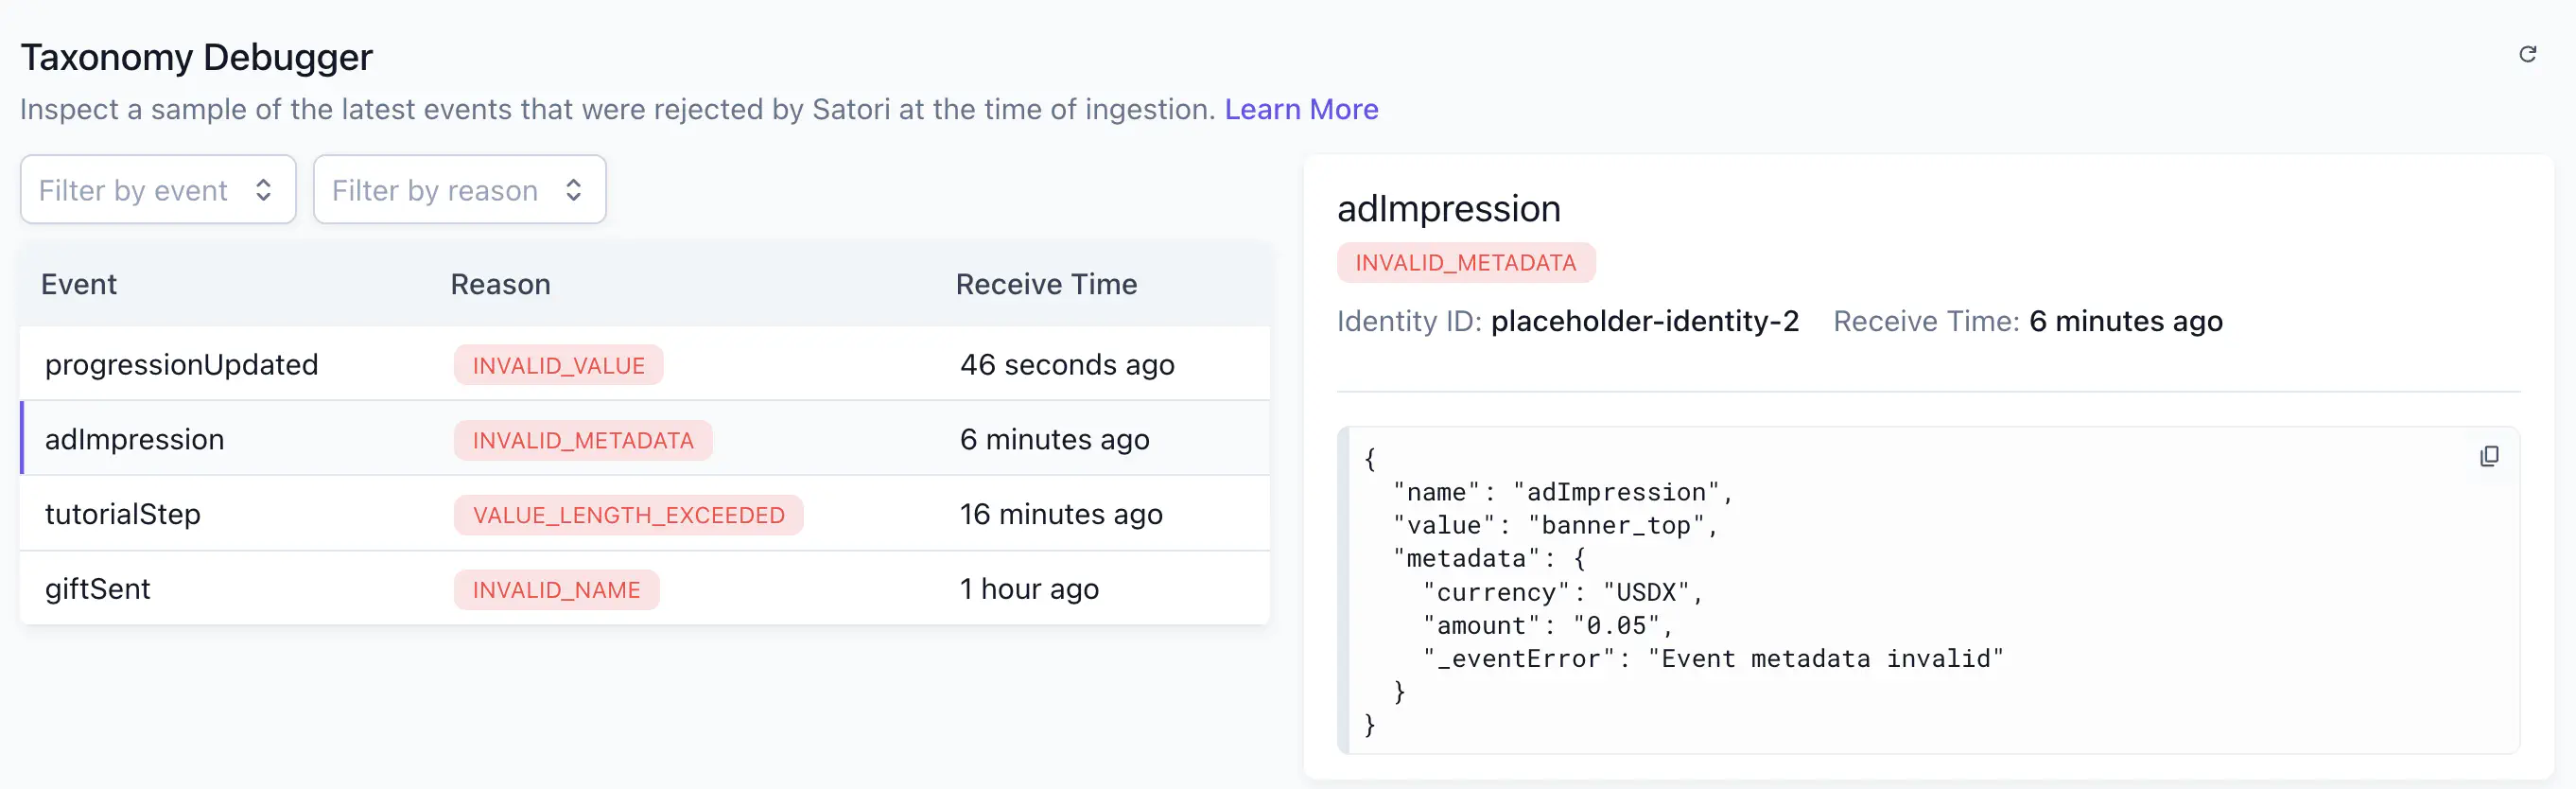
Catch bad data before it skews your metrics
Bad telemetry is silent. A misspelled event name or a mistyped value doesn’t throw an error in your game client. It just disappears from your metrics.
We’ve built event validation directly into the dashboard. Satori checks every incoming event against your taxonomy and surfaces failures immediately with a plain-language rejection reason. Spot integration issues during QA or soft launch, when they’re cheap to fix.
Analytics dashboards are available now for every Satori project. Schedule a demo call to see how it can accelerate liveOps for your game.

Get Started


