
Game Player Analytics: Metrics That Actually Predict Retention


Most dashboards drown you in numbers. Only a few of them tell you who’s coming back tomorrow.
Game player analytics are the metrics that show how cohorts of players behave after they install: whether they form a habit, come back, and spend. They are distinct from vanity totals like lifetime downloads, because you read them per cohort and per lifecycle stage.
Game player analytics fail teams in a specific way. You get a wall of charts, and none of them answer the one question that matters for a live game. Will this player come back? Installs look great in a launch deck and predict almost nothing. The metrics that predict retention live one layer down, in how individual cohorts behave across their first month. This piece groups the player analytics metrics that move retention by player lifecycle, tells you what each one signals, and shows how our Satori dashboards surface them.
What player analytics matter most?
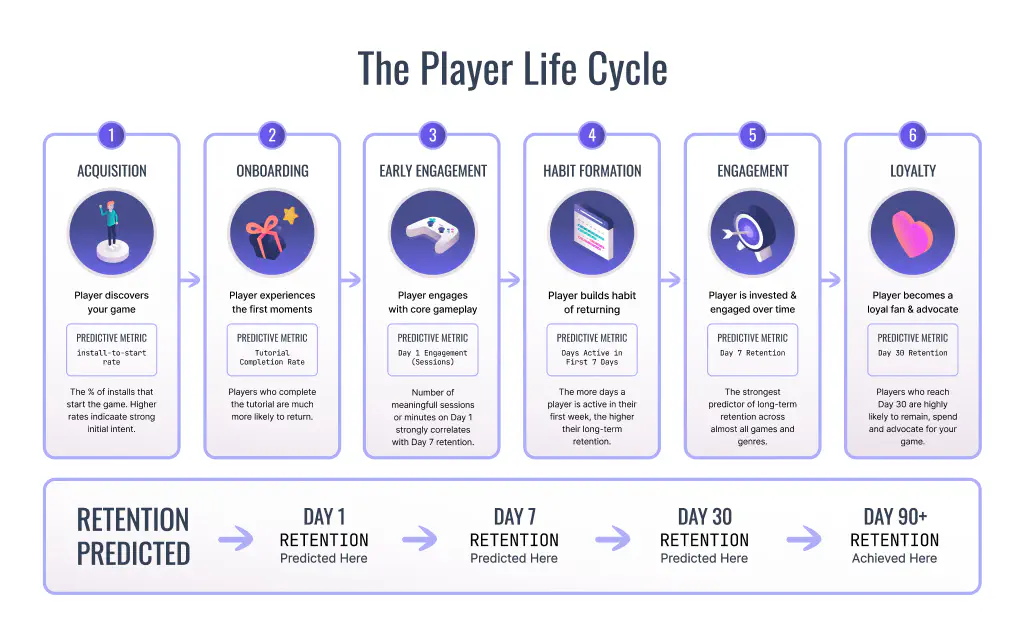
The player analytics that matter most are the ones tied to a stage of the player lifecycle and read as cohorts. A metric predicts retention when it tells you something about a group of players before they churn, not after. A blended total tells you what already happened. The stages below move in sequence, so a weak signal early shows up as churn later.
| Metric | Lifecycle stage | What it signals | How it is calculated | Where it lives in Satori |
|---|---|---|---|---|
| Cohort quality by source | Acquisition | Whether a channel brings players who return | D1 and D7 return rate by acquisition channel | Retention report, filtered by source |
| RoAS | Acquisition | Whether a cohort recovered UA spend | Cumulative LTV divided by CPI, Day 0 through Day 30 | RoAS report (MMP required) |
| Onboarding completion | Acquisition | Whether new players finish the first session | Funnel completion on onboarding events | Funnels |
| DAU / WAU / MAU | Engagement | Size of the active base over each window | Unique players active in the day, week, or month | Game Metrics dashboard |
| Stickiness | Engagement | How often the monthly base returns | DAU divided by MAU | Game Metrics dashboard |
| Session depth | Engagement | Whether sessions are getting longer or more frequent | Average session count, playtime, and duration | Retention report |
| Funnel drop-off | Engagement | Where the core loop leaks | Cumulative drop-off at each step | Funnels |
| D1 / D7 / D30 retention | Retention | Whether cohorts come back | Share of the cohort active on that day, or by that day in cumulative mode | Retention report |
| Conversion rate | Monetization | Share of active players who spend | Spenders divided by active players, by player segment | Custom metric, read by segment |
| ARPDAU | Monetization | Revenue intensity of the daily base | Revenue divided by DAU | Game Metrics dashboard |
| LTV | Monetization | Cumulative revenue per player | Average IAP plus ad revenue per player, cumulative | RoAS report |
Four stages carry the game analytics KPIs worth watching.
Acquisition. Are the players you paid for worth keeping? A puzzle studio buying installs checks early cohort quality, not raw install count.
Engagement. Do players form a habit? A shooter watches session frequency and how deep players get into a match loop, then shortens the queue when frequency falls before Day 7 does.
Retention. Do cohorts come back on Day 1, Day 7, and Day 30? An RPG reads each cohort against its own genre curve rather than a blended studio average.
Monetization. Does engagement convert without burning goodwill? A merge game watches spend depth alongside session health, so a revenue spike that coincides with shorter sessions still shows up as a warning.
Acquisition: are you buying players who stay?
Acquisition analytics answer whether the players you paid for are worth keeping.
Cohort quality by source. Group new players by acquisition channel and watch their Day 1 and Day 7 behavior, not their headline count. One channel can bring cheap installs that never return.
RoAS by cohort. RoAS analytics show whether a paid cohort paid itself back. Our Satori RoAS report tracks return on ad spend from Day 0 through Day 30. It combines cost-per-install from your mobile measurement partner with lifetime value from Satori. A cohort above 100 percent has earned back its acquisition cost. Below that, it hasn’t yet. The report populates after you enable an MMP integration in Settings > Integrations. Satori currently supports Adjust.
Onboarding completion. Whether a new player finishes onboarding is an early read on retention. Build it as a funnel and watch where fresh cohorts drop off.
Engagement: is a habit forming?
Game engagement metrics show whether players are forming a habit. That habit is what turns a download into a retained player.
Active users and stickiness. Count active players over daily (DAU), weekly (WAU), and monthly (MAU) windows. Stickiness is DAU divided by MAU, and it shows how often your active base returns.
Session depth and duration. Our Satori retention report tracks average session count, playtime, and session duration. Track it by cohort so a drop in depth shows up before the cohort churns.
Funnel drop-off. Chain the events in a core loop into a funnel. A funnel shows player counts, average completion time, and cumulative drop-off at every step. Set a time limit on any step to flag players who stall.
How to measure player retention
Game retention analytics work by cohort. Track D1, D7, and D30 return rates for each new-player group, then read those curves against your own genre.
A single blended retention number hides which cohorts are improving and which are decaying. Cohort analysis breaks players into groups by install date or source, so patterns show up across the lifecycle. A strategy game might post healthy Day 1 numbers across every source, then watch one paid channel collapse by Day 30 while organic holds. A blended average buries that. Segment the curve to see whether a specific audience, platform, or region is driving the drop.
Retention rate is the share of a cohort that returns. In classic (Day N) counting, a player counts as retained only if they are active on that exact day. In rolling or cumulative counting, they count if they returned on that day or any later day.
Two counting methods exist. Pick one and stay consistent.
| Retention type | Counts a player as retained if active | Best for |
|---|---|---|
| Classic (Day N) | On exactly that day | A strict, comparable daily curve |
| Rolling | On that day or any later day | Knowing whether a player ever returned |
In Satori’s retention grid, cumulative mode reads rolling totals, so you see who returned at least once by a given day instead of on that exact day.
Retention and its inverse, churn, are lagging outcomes. To reduce game churn rate, watch the leading signals instead. When session frequency drops or funnel drop-off climbs for a segment, act while that cohort is still active.
Use this map to move from a warning sign to a first action instead of staring at a chart. Each row starts from a signal Satori already tracks.
| Early warning sign | Likely cause | Metric to check first | First action |
|---|---|---|---|
| Day 1 cohort retention drops for new installs | Onboarding or first-session friction | First-session funnel completion | Fix the step with the biggest drop-off |
| Day 7 holds but Day 30 falls | Thin mid-game content or loop fatigue | Session count and duration by cohort | Schedule a live event for the lapsing segment |
| Sessions per user fall week over week | A habit is not forming | Stickiness, DAU over MAU | Add a daily reason to return, then measure it |
| Revenue is flat while DAU rises | Weak conversion, not weak traffic | ARPDAU and conversion by segment | Test an offer for an engaged non-spender segment |
Monetization: does engagement convert?
Monetization analytics show whether engaged players convert into revenue without the mechanics that push them away.
ARPDAU and revenue. ARPDAU is average revenue per daily active user: revenue divided by DAU. Our Satori Game Metrics dashboard reports ARPDAU and revenue out of the box, with no setup. Revenue can rise on a few big spenders while ARPDAU falls, so read them together.
Conversion and spender depth. Conversion rate is the share of active players who spend. Track what share of active players convert, and whether spenders keep spending, by player segment, using player segmentation to compare groups.
LTV. Lifetime value is the cumulative revenue a player generates, from in-app purchases and from ads. In Satori’s RoAS report, Avg. LTV (Total) is IAP LTV plus ad LTV, and RoAS is that figure divided by CPI. Read LTV by cohort so a high average is not hiding a few whales.
Where the events come from. Hiro provides the economy those metrics describe: a virtual wallet, a store for soft or real currency, and rewarded video ads. Every purchase and grant becomes an event Satori can measure.
How the Heroic stack surfaces these metrics
Satori is our game LiveOps and player engagement platform for live games. Its performance monitoring is built into the same system you use to run experiments and live events. You measure what you launched without exporting to a second behavioural analytics tool.
The Game Metrics dashboard ships built-in reports for retention, session depth, ARPDAU, and revenue with no setup. RoAS populates after you enable an MMP integration. You can build custom dashboards with widgets for funnels, retention, and RoAS that render on your live data. Define a custom metric once against any event your game tracks, then reuse it as a goal inside a live event or experiment.
Every metric traces back to one player profile. Hiro emits economy events, Satori ingests them alongside the rest of your analytics, and event-derived properties drive the segments you target. That is player analytics across the Heroic stack, not four disconnected tools.
For larger studios, publishers, and enterprise teams running at scale, Heroic Cloud is the managed path. It gives you dedicated Satori deployments, multi-region operations, and SOC 2 Type II without a rewrite.
Stop grading launches by installs. Group your game player analytics by lifecycle, read every cohort against its own curve, and you’ll see churn coming while you can still change it. See how our Satori dashboards track retention, session depth, ARPDAU, and revenue out of the box, and RoAS once your MMP is connected.
FAQ
What are the best game analytics metrics for a live game?
Do I need a separate analytics tool for my game?
Which player analytics predict churn earliest?
What is stickiness, and how do I read it?
Built for live games
See how Heroic Labs helps studios run LiveOps that move retention and revenue.
Walk through Satori: retention and RoAS analytics, audiences, A/B tests, and live events in one LiveOps workflow. Book a demo to see it in action.
- SOC 2 Type II certified
- Audiences, A/B tests & live events in one platform
- Supporting $5B+ in games revenue
